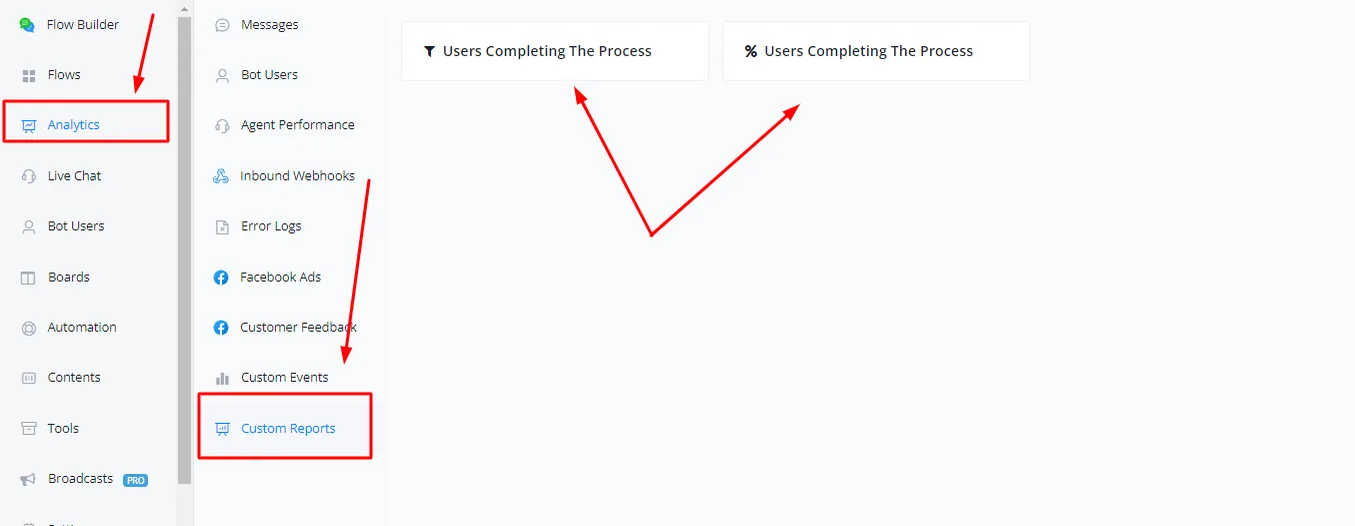

Log Custom Event
NicoChat now allows your users to track the various events that happen within the channel's automations and view them in Statistics, in the form of custom events and custom reports
You will now be able to track any custom events you want and build collaborative analytical reports from them, which gives you more visibility into your data and provides metrics to track the performance of your channel and your automations.
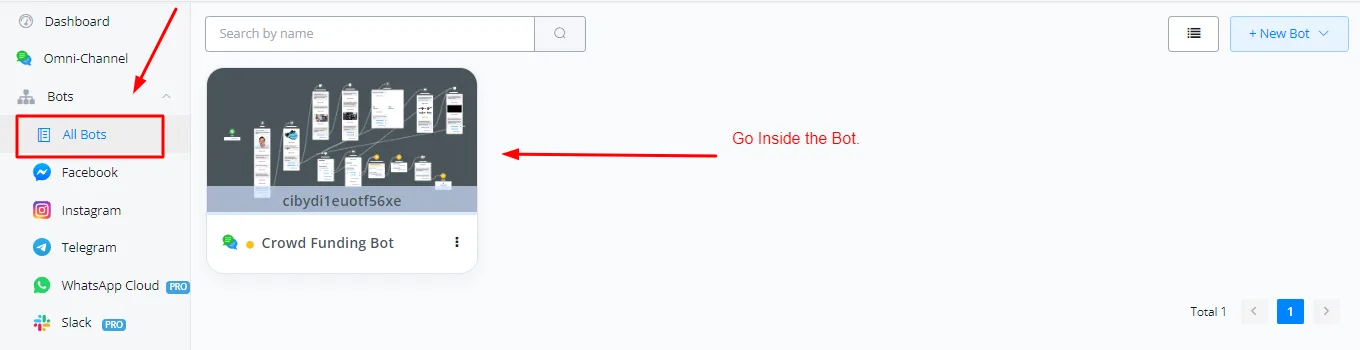
On your dashboard, click the channel and go into the flow builder.
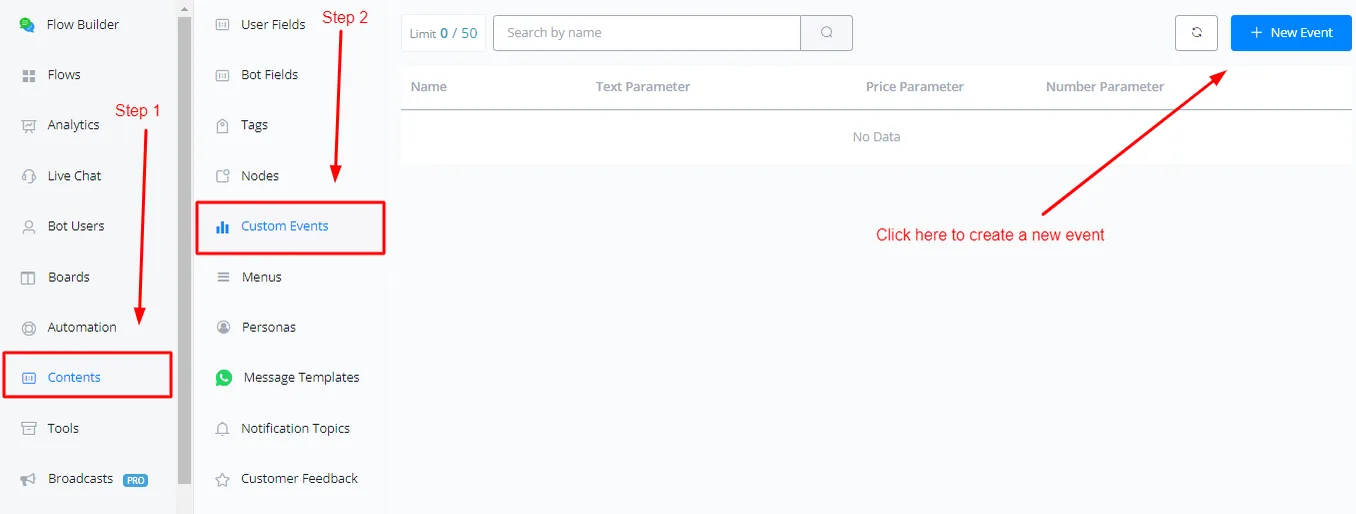
In the flow builder, select the Content tab and then Custom Events.
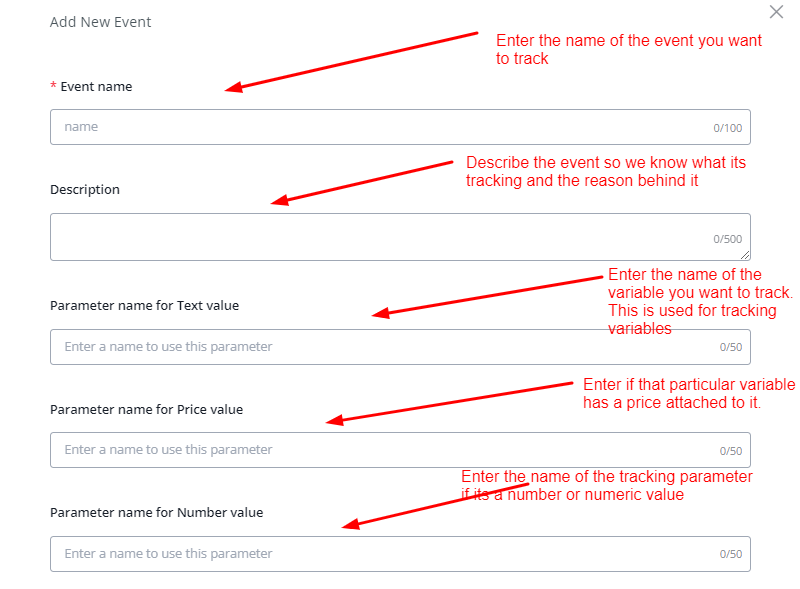
When creating a new event, you must provide the following parameters.
Event Name: used to name the custom event.
Event Description: used to describe what the custom event does and tracks.
Parameter Names: these are the names of the parameters you want to track — for example, product, sales category, person's name, and so on.
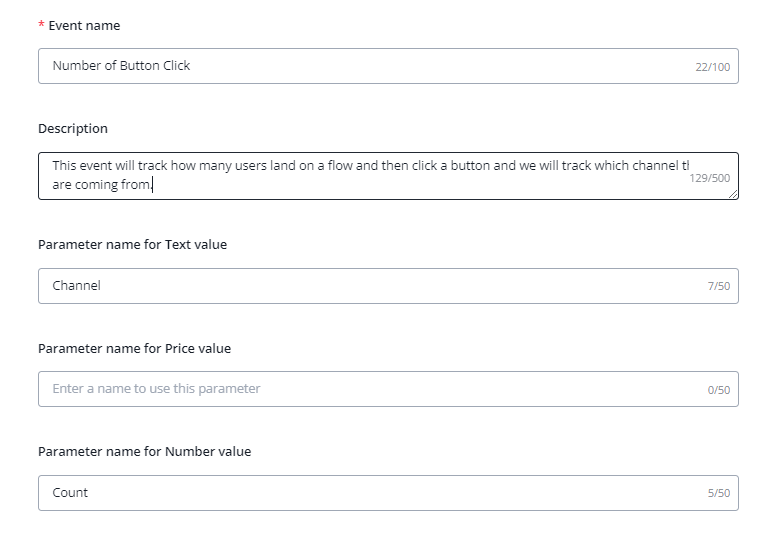
After creating an event, go into the flow builder and add the “Custom Event” action, from the Action block, to start integrating the event and tracking it.
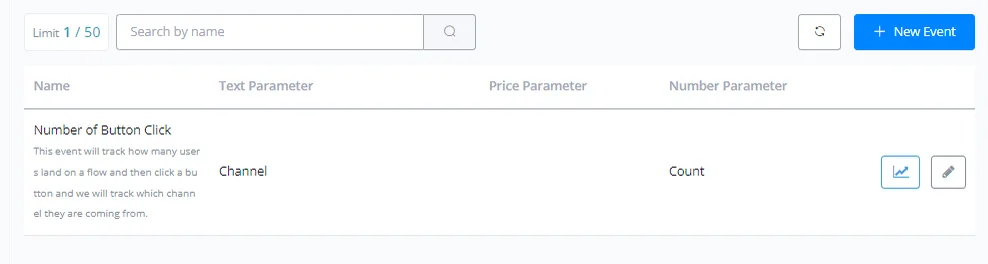
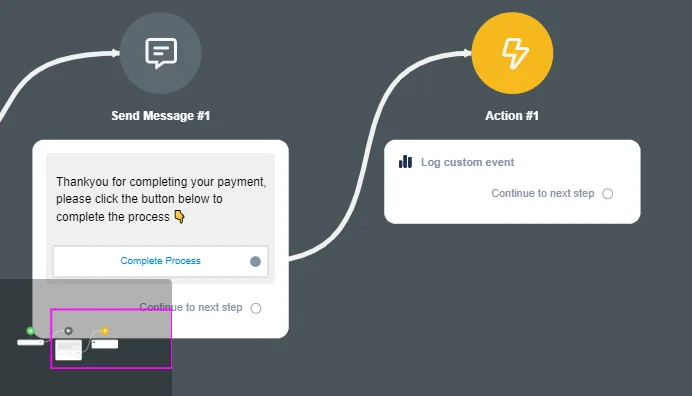
Click Edit Action and start setting up the event.
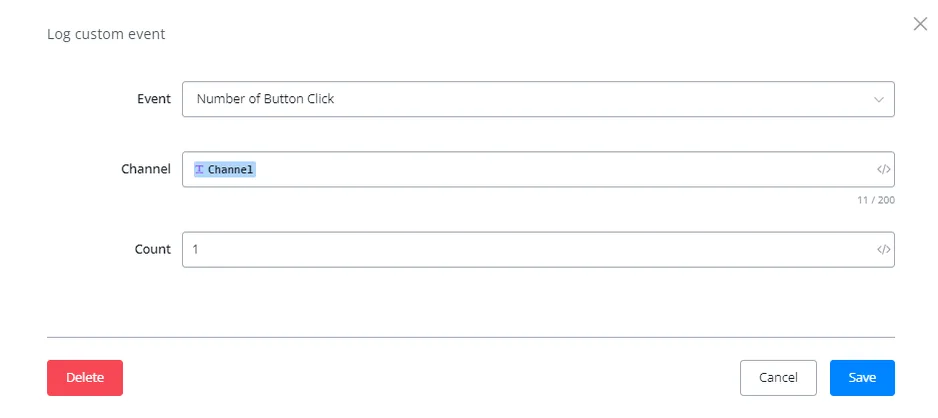
Here, the event will track the Channel the users come from, and the count will add one unit to the total number of times the event occurred.
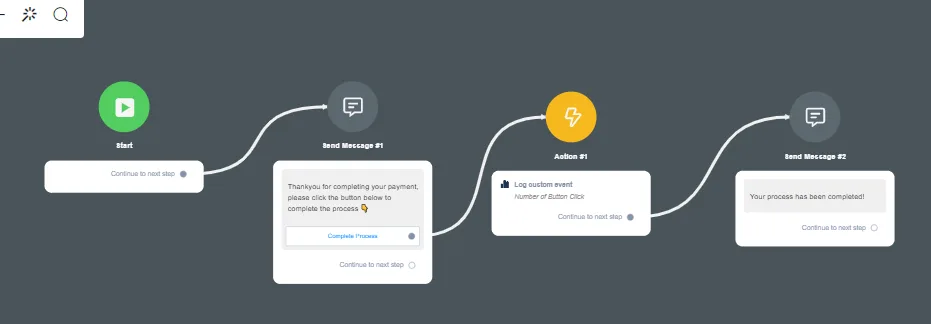
The event is now ready to be tracked.
Click the Statistics tab and select Custom Events to see the statistics of a specific event.
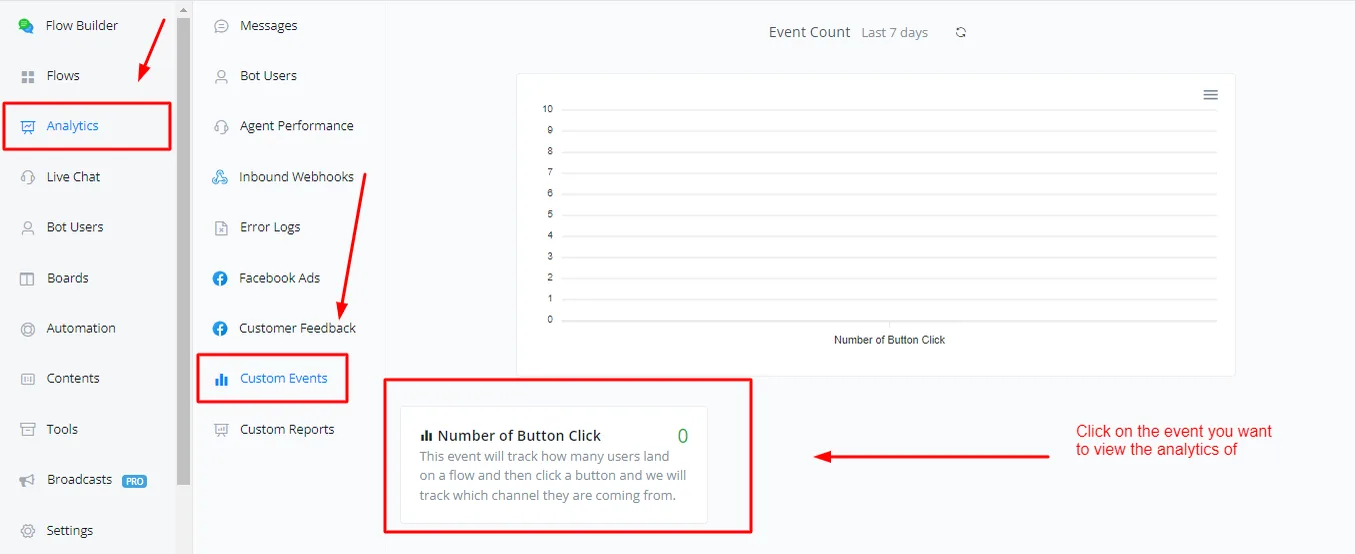
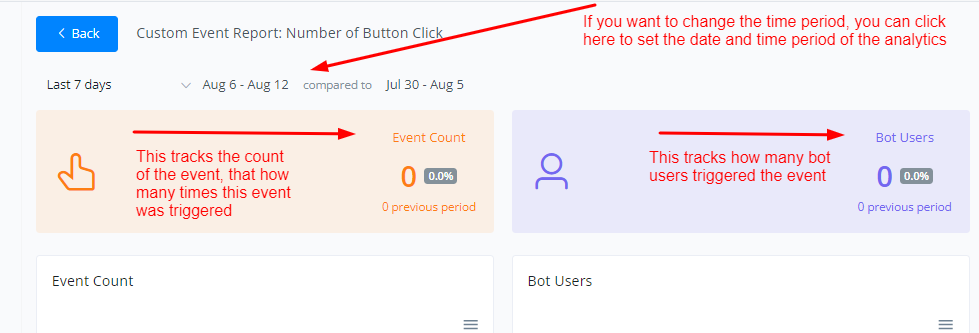
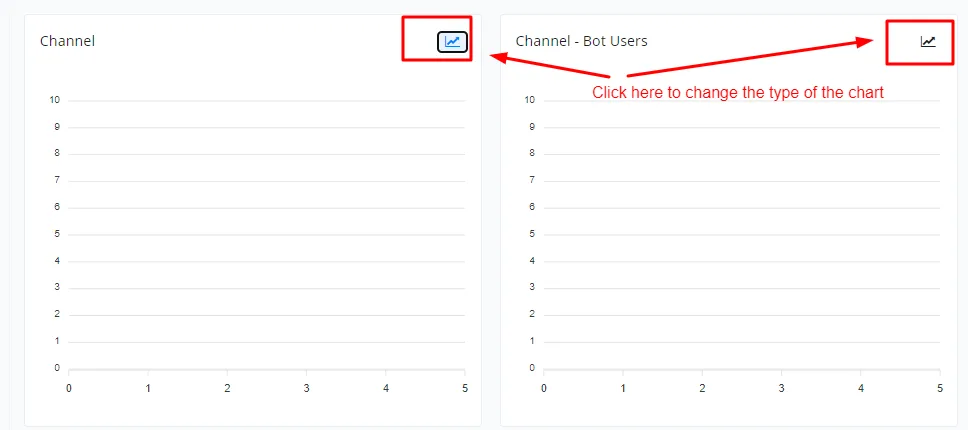
Click the event to see the statistics of that event in more detail.
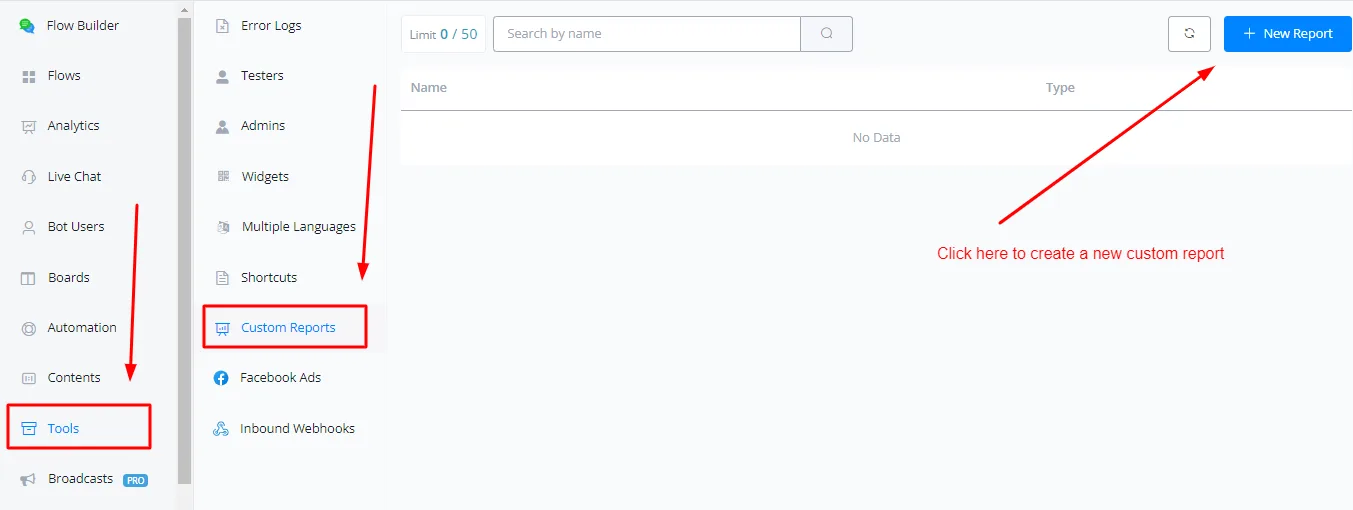
To create a custom report, click the Tools tab and select Custom Reports.
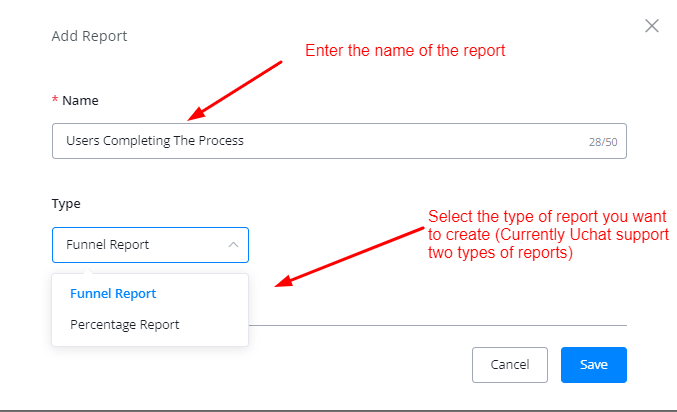
Enter the name and the type of the report.
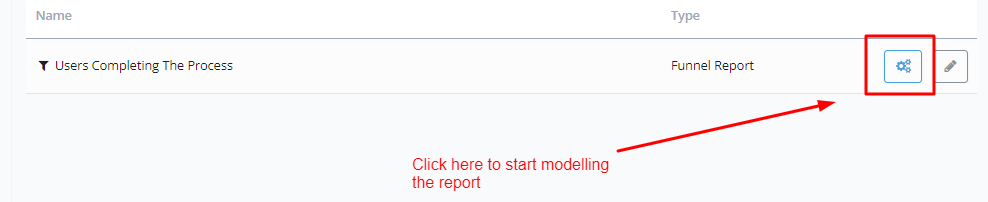
Click the gear icon to start modeling your reports.
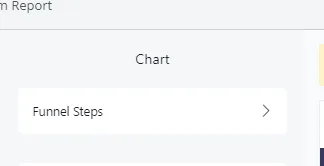
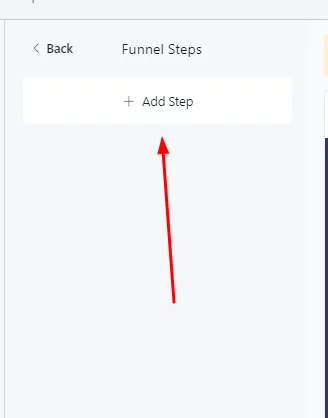
Click “Funnel Steps” to start adding custom events to your report.
Click “Add Step”.
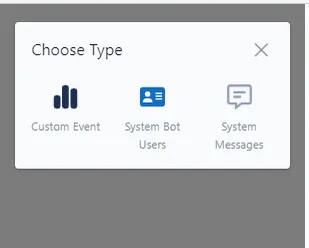
Select the type of event you want to track.
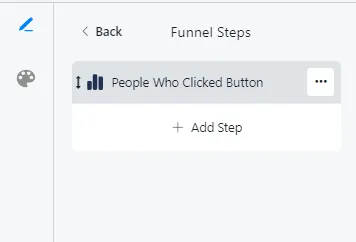
After adding the event, click the three-dot icon to start customizing it.
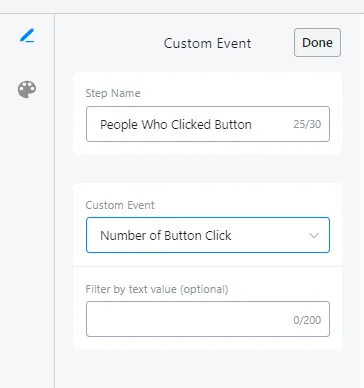
Set up the events you want to track within this event. Click the Done button.
You can add more steps to your funnel report if you want to build a collaborative or comparison report across several events and monitor performance on multiple fronts.
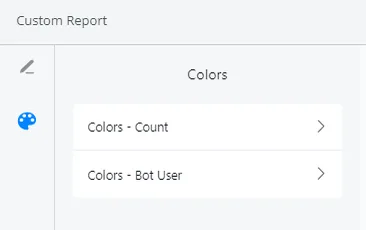
If you want to change the colors of the trendline charts and the bar charts, click the palette icon in the top left corner and choose the chart whose color you want to change.
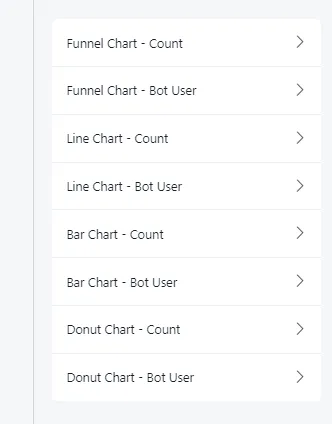
You can also edit the charts and tables themselves: change labels and axes, and enable or disable their display in the report.
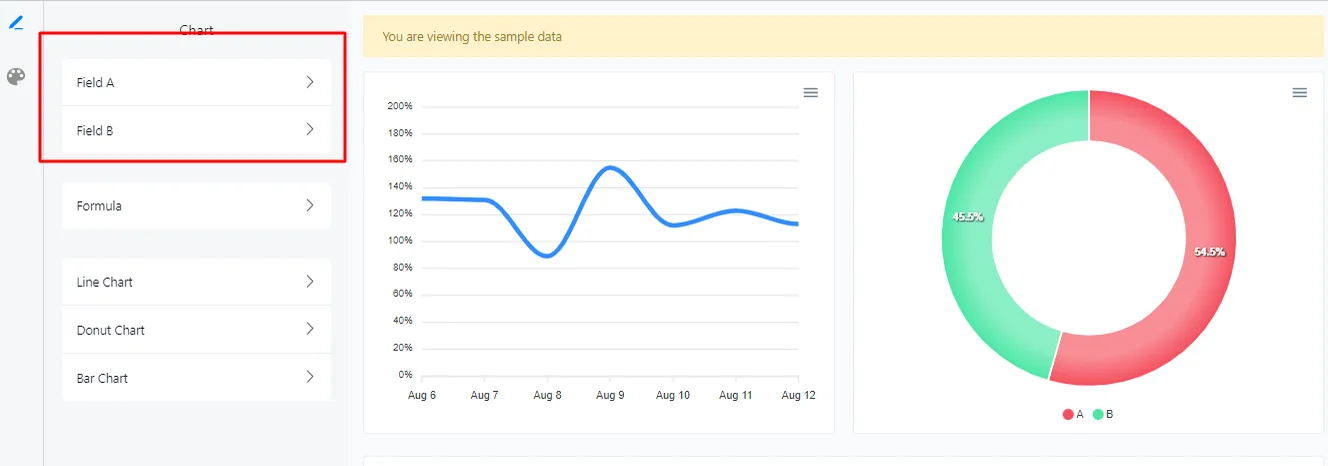
In percentage reports, you can compare two events and find out how one performs relative to the other.
To add the events, click Field A and Field B.
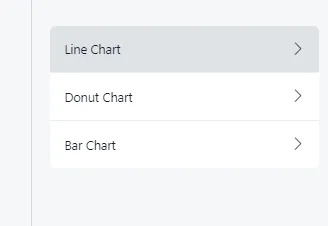
To edit the charts and tables, click here and adjust them to your needs.
Percentage reports let you add formulas to calculate the percentage and the appropriate event.
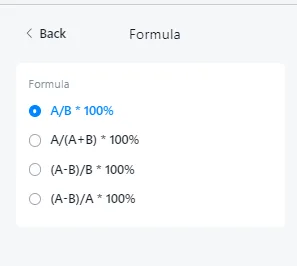
This formula compares the two fields and calculates the relative percentage between them. For example:
- Field A can be the number of students in class A, and Field B the total number of students in a school. This formula helps you calculate the percentage of class A students relative to the school's total number of students.
- Field A can be the number of sales of product A, and Field B the total number of sales. This formula helps you calculate the percentage of sales of product A.
This formula compares the two fields and, just like formula 1, provides the relative percentage. Here, Field A and Field B can be the two parts. The denominator is the sum of the parts.
Field A can be the number of users going through flow A, and Field B the number of users going through flow B. This formula shows how many people went through each flow, which is important for A/B testing.
This formula compares the two fields and provides a value that is not obtained directly. For example, consider an SMS marketing campaign. We can track the total number of people targeted by the campaign and the people who replied asking to be put on the DNC (Do Not Contact) list. With this formula, we can arrive at the actual number of people who responded to the campaign, that is, the actual response rate.
To see the custom reports, click the Statistics tab and select Custom Reports.