
Resolutions (Statistics)
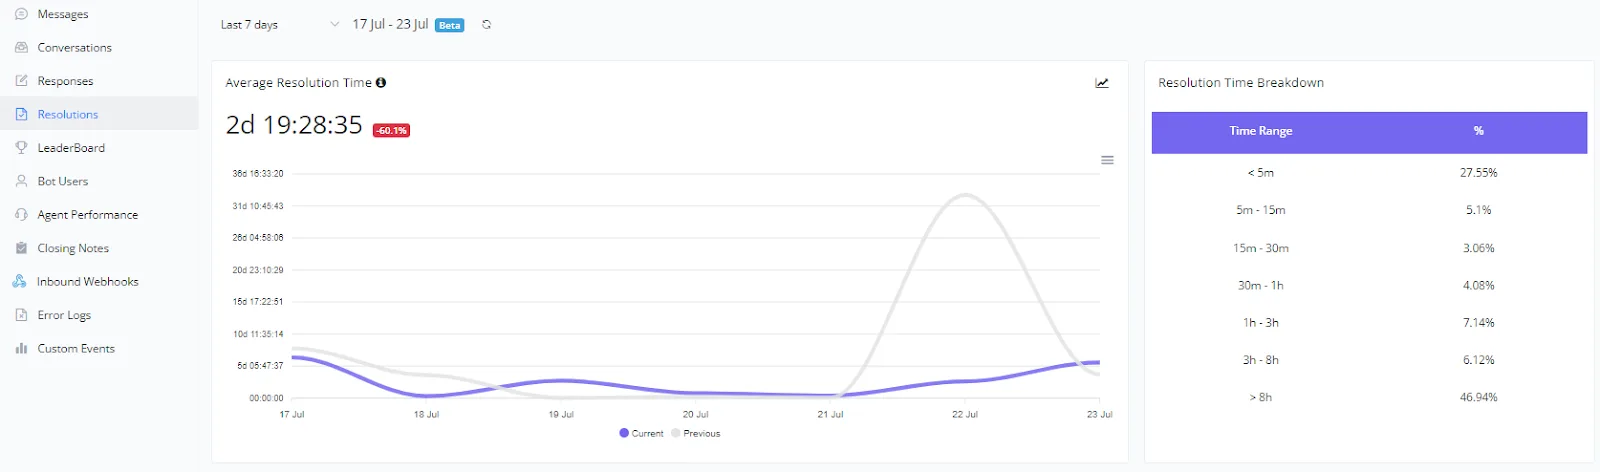
The Average Resolution Time is a crucial metric that helps us assess the efficiency of our customer service process. This metric indicates the average time it takes to resolve and close a conversation.
The Average Resolution Time is a crucial metric that helps us assess the efficiency of our customer service process. This metric indicates the average time it takes to resolve and close a conversation. Below are the details of this metric:
- This line chart shows the average time it takes to resolve a conversation from start to finish. Monitoring this metric allows us to identify trends and possible delays in the resolution process, which helps us implement continuous improvements.
- This bar chart shows the distribution of resolution times across different time intervals. It helps us understand how long conversations take to be resolved and whether there are specific patterns that can be optimized for more efficient service.
Below is a visual example of these charts:
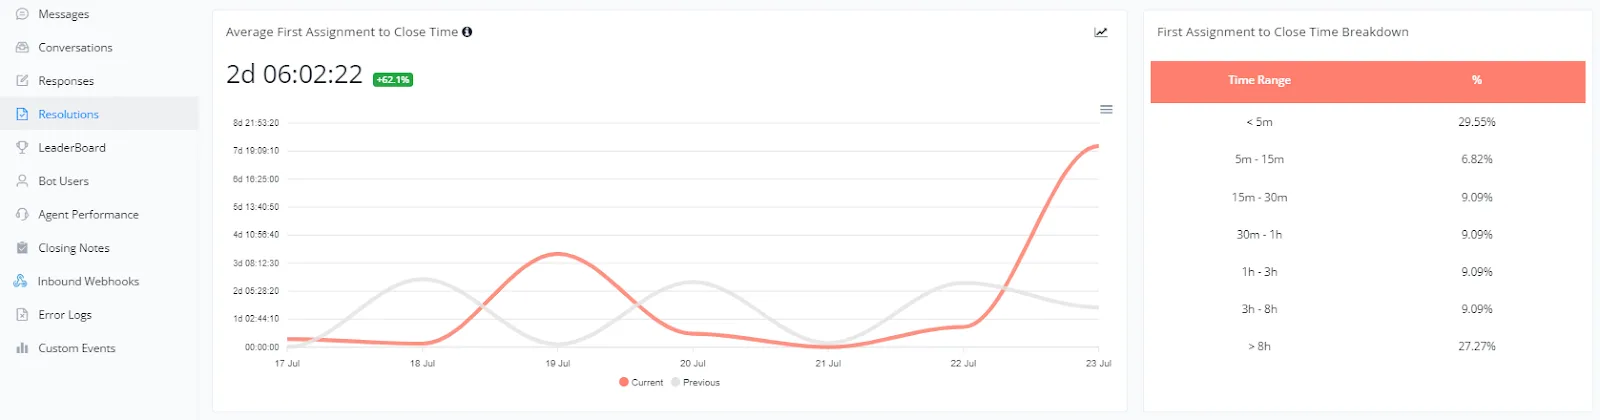
To monitor the efficiency of our resolution process from the start, we analyze the Average Time from First Assignment to Closure. This metric helps us understand how long it takes from when a conversation is assigned to an agent until it is resolved and closed. Below are the details of this metric:
- This line chart shows the average time it takes for a conversation to be closed after its first assignment. It helps us assess the effectiveness of the resolution process from start to finish and identify areas that may need improvement.
- This bar chart shows the distribution of closing times across different time intervals after the first assignment. It helps identify how quickly issues are being resolved and whether there are specific steps that can be optimized for faster closure.
Below is a visual example of these charts:
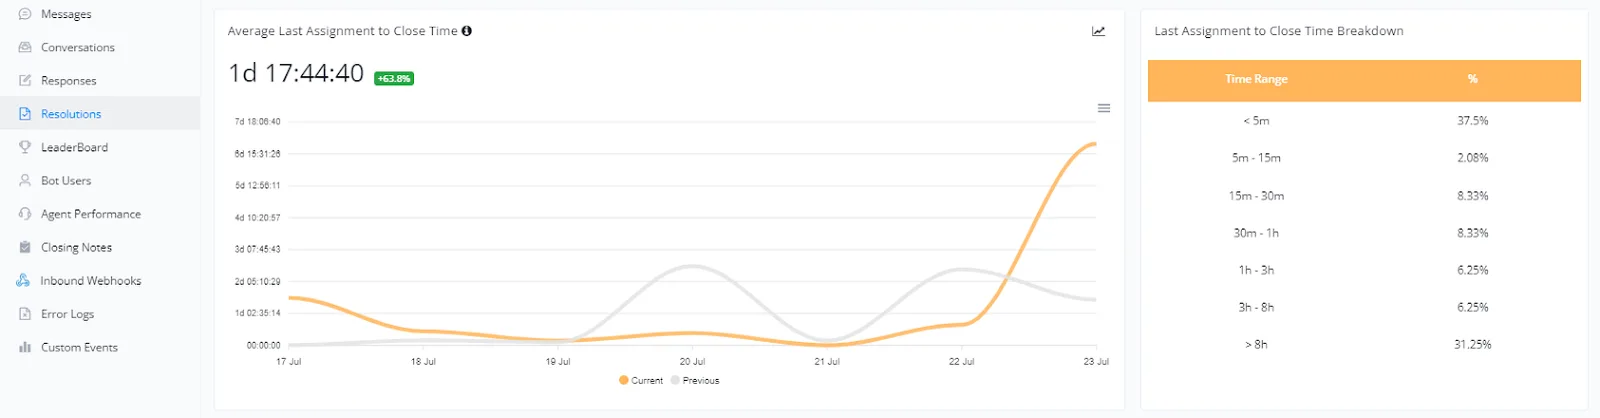
To better understand the efficiency in resolving conversations, we analyze the Average Time from Last Assignment to Closure. This metric indicates how long it takes from when a conversation is last assigned to an agent until it is finally resolved and closed. Below are the details of this metric:
- This line chart shows the average time it takes for a conversation to be closed after its last assignment. It helps us assess the effectiveness of closing conversations and identify any potential delays.
- This bar chart shows the distribution of closing times across different time intervals after the last assignment. It helps identify the efficiency of the final resolution process and whether there are steps that can be optimized for faster closure.
Below is a visual example of these charts:
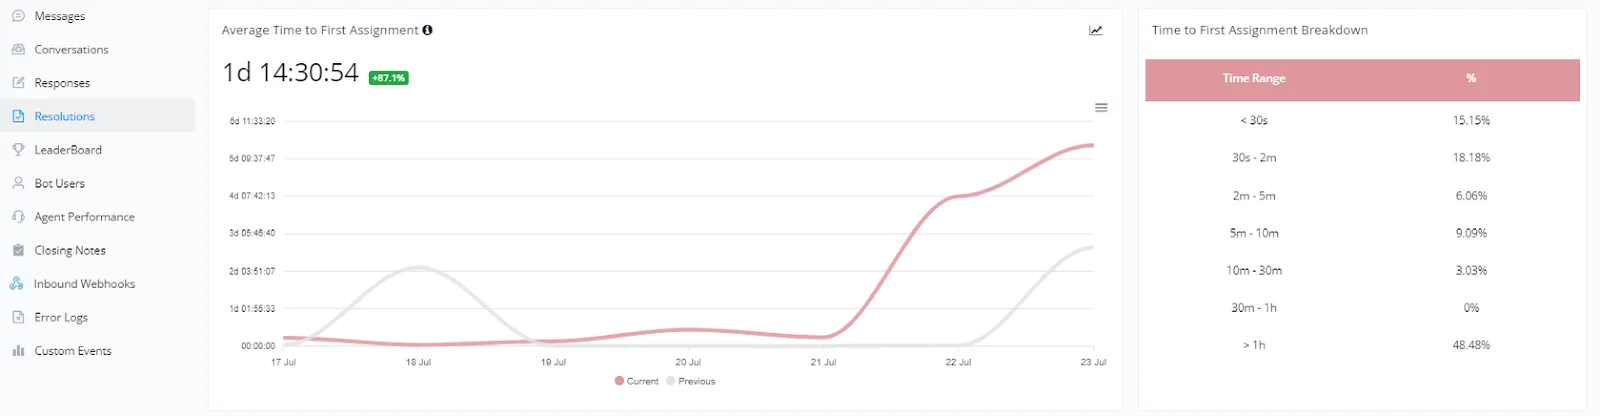
To monitor workflow efficiency and ensure that conversations are handled promptly, we analyze the Average Time to First Assignment. This metric shows how long it takes for a conversation to be assigned to an agent after it is received. Below are the details of this metric:
- This line chart shows the average time it takes for a conversation to be assigned to an agent. It helps us assess how quickly conversations are being directed toward resolution.
- This bar chart shows the distribution of assignment times across different time intervals. It helps identify the efficiency of the assignment process and whether there are significant delays that need to be addressed.
Below is a visual example of these charts:
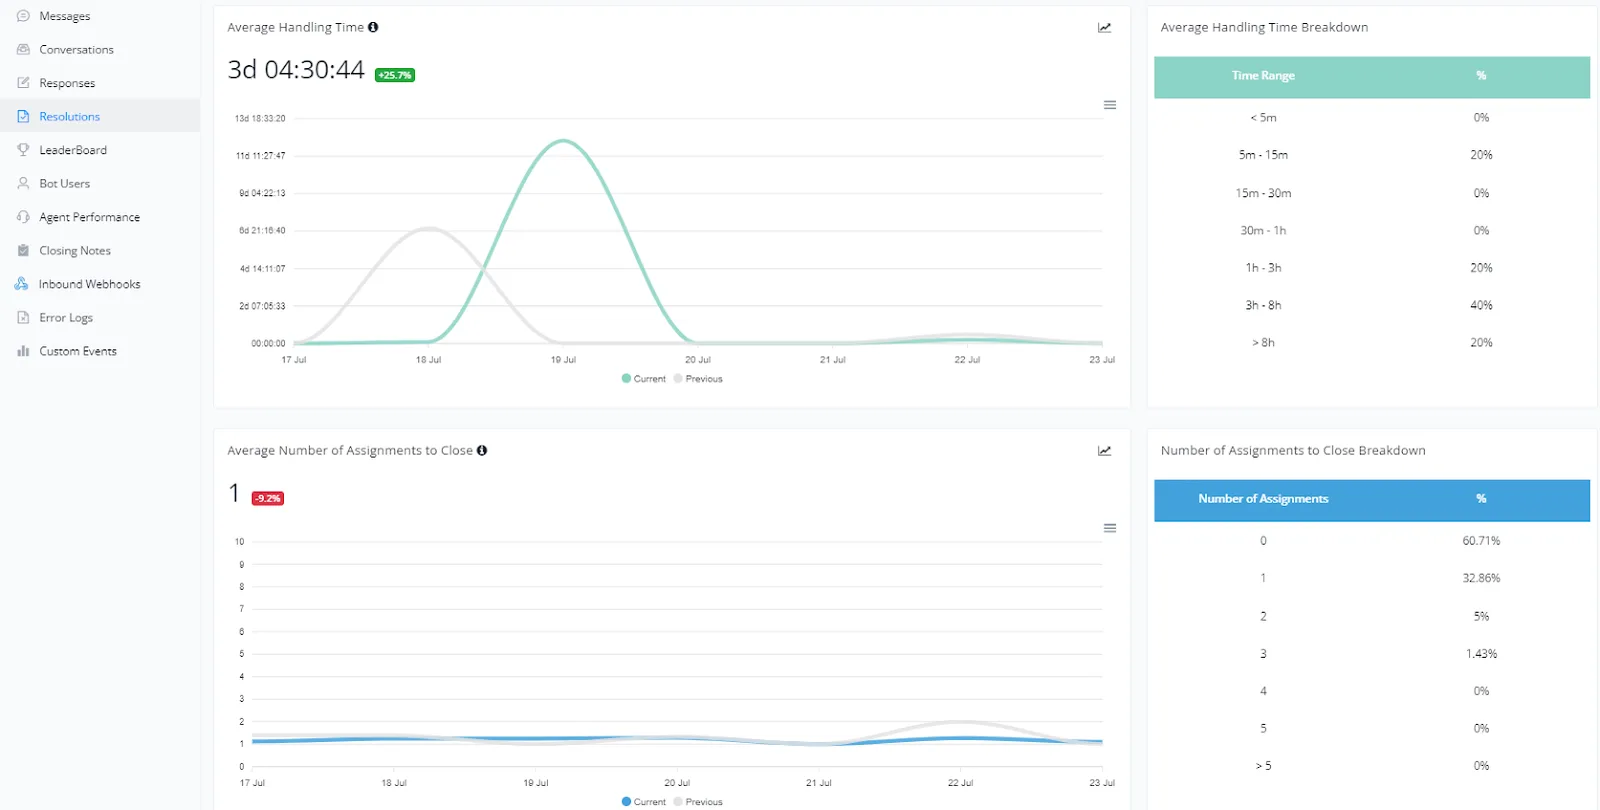
To further improve customer service, we monitor the Average Handling Time and the Number of Assignments until Closure. These metrics provide detailed insights into agent efficiency and workload. Below are the details of these metrics:
- This line chart shows the average time an agent takes to handle a conversation from start to resolution. It is important for assessing the efficiency of customer service and identifying areas that may need optimization.
- This bar chart shows the distribution of handling times across different time intervals. It helps identify how long conversations typically take to be resolved, providing insights into possible improvements in the service process.
- This line chart shows the average number of times a conversation is assigned to different agents before it is closed. This can indicate the complexity of customer issues or the need for additional agent training.
- This bar chart shows the percentage of conversations closed after a certain number of assignments. It helps understand workflow efficiency and whether adjustments are needed to reduce the number of transfers between agents.
Below is a visual example of these charts: