

Facebook Lead Forms (Statistics)
The Facebook Lead Forms Report analyzes the leads generated by the forms and helps you evaluate the effectiveness of lead capture campaigns.
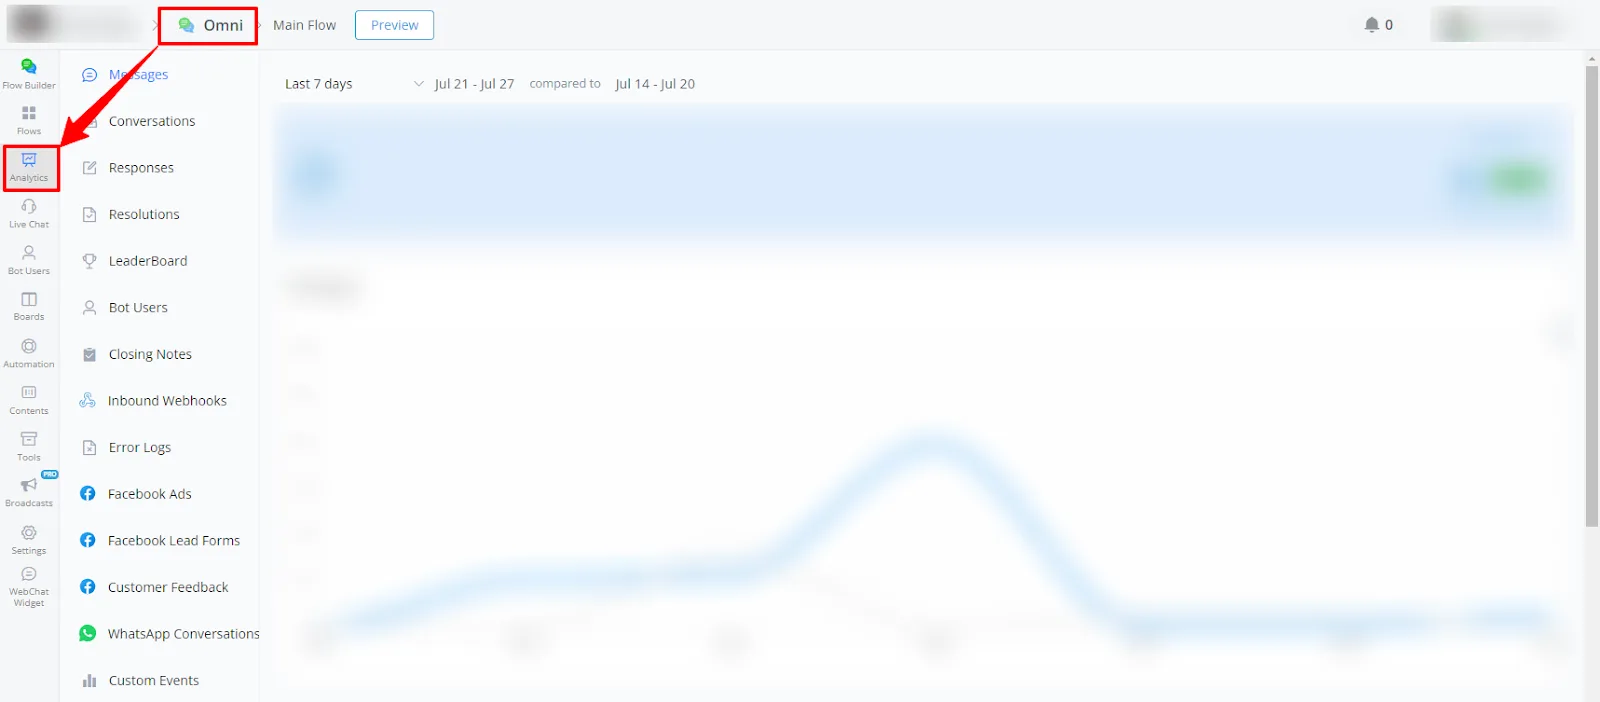
- In your channel, go to Statistics.
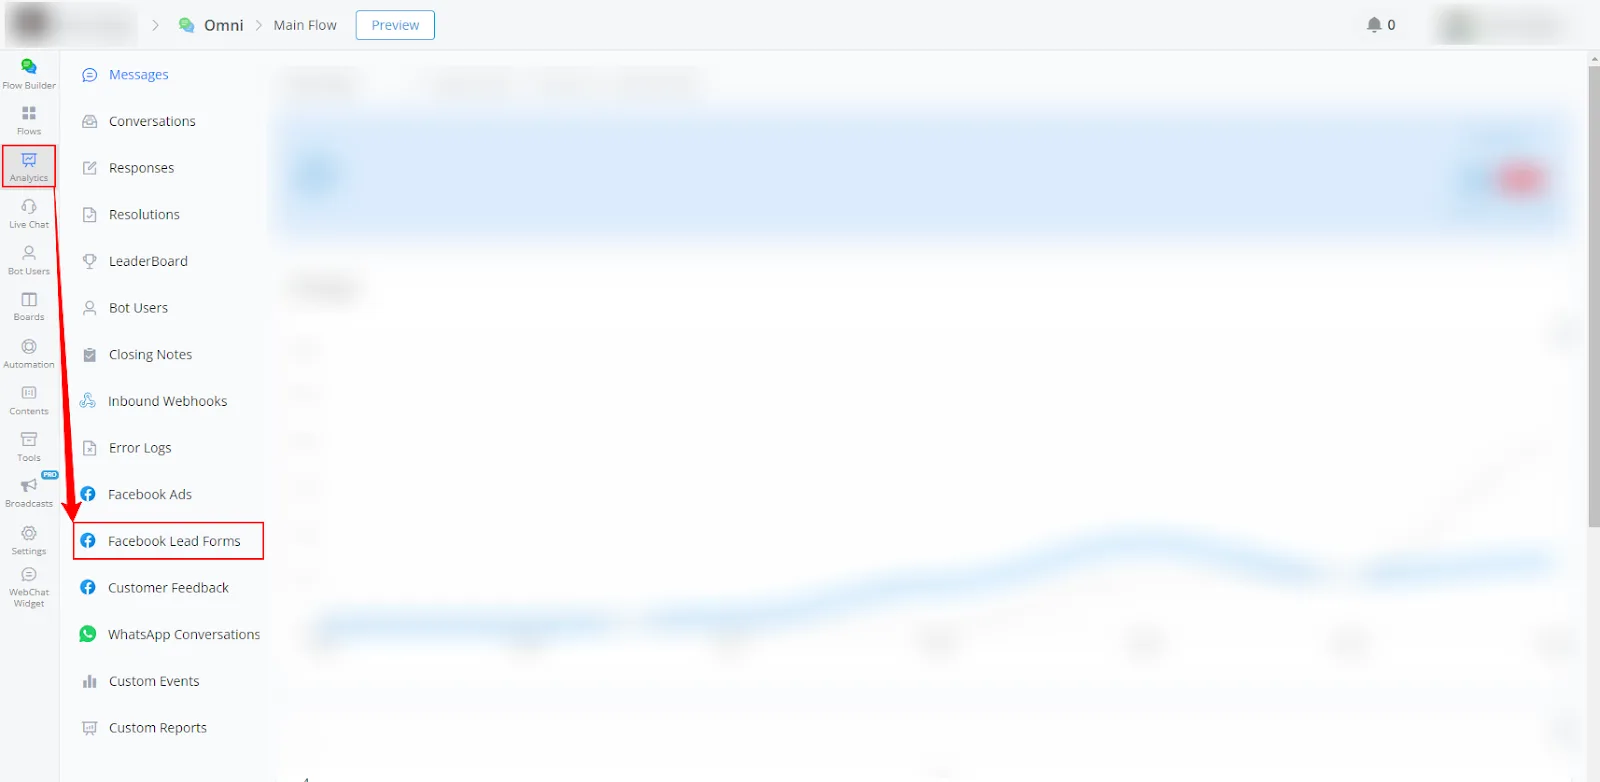
- Select Facebook Lead Forms from the left-side menu.
Available report types
Here is a brief explanation of the graphs in the Facebook Lead Forms reports:
Line graphs
- Clicks:
The orange line represents clicks in the current period. The gray line represents clicks in the previous period. - Contacts:
The blue line represents contacts in the current period. The gray line represents contacts in the previous period.
Filtering
- In the Facebook Lead Forms reports, you can filter the data displayed in the graph by all ads or by a specific ad reference payload, which allows for a more detailed performance analysis.
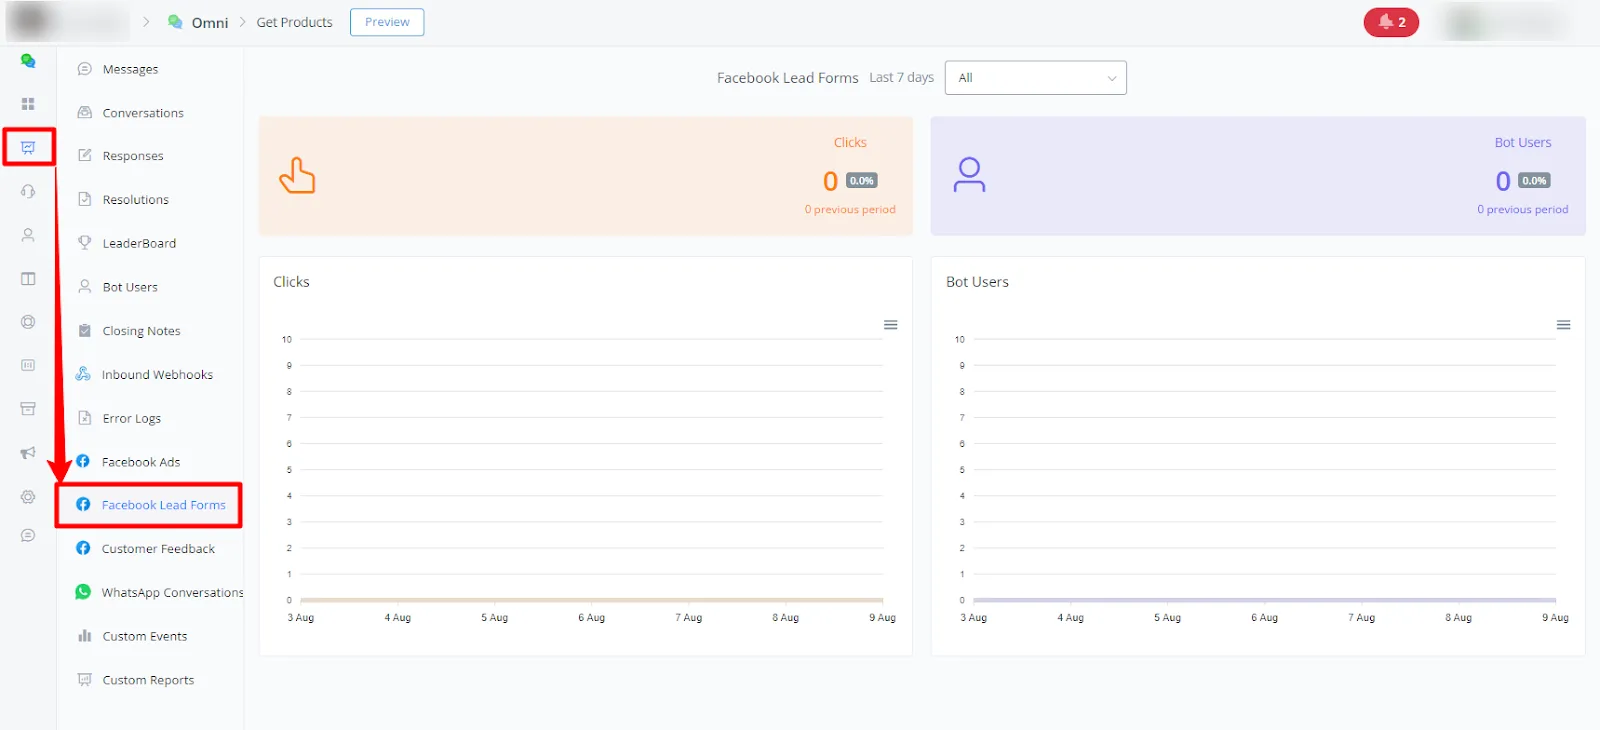
These descriptions help you interpret the graphs and use the available filters to analyze the relevant data in each report.
If you need further help, open a ticket at discord.com/channels/1147227963792830534/1153402986240946358