

WhatsApp Conversations (Statistics)
The WhatsApp Conversations Report tracks the interactions made through WhatsApp, which are essential for evaluating engagement and communication effectiveness.
- In your channel, go to Statistics.
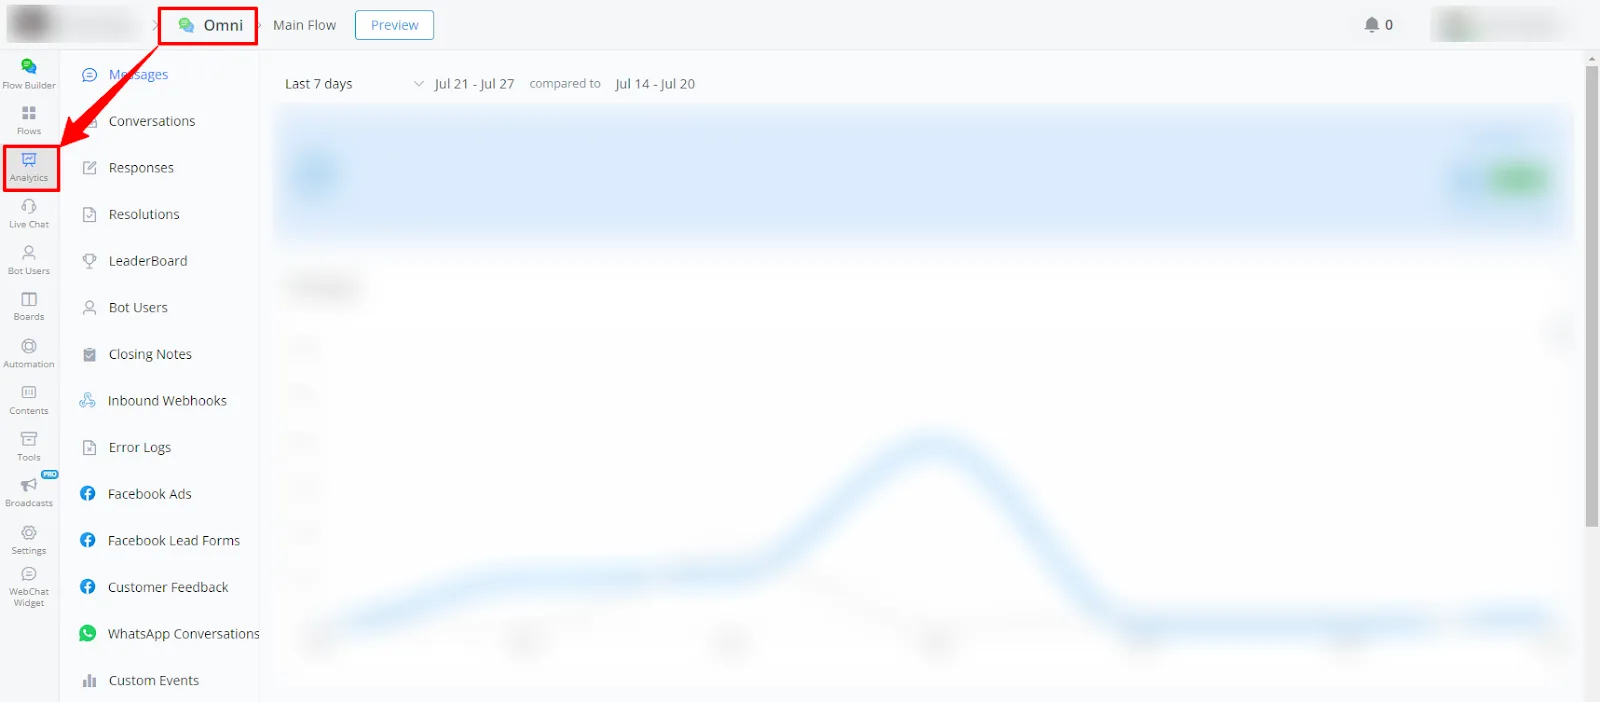
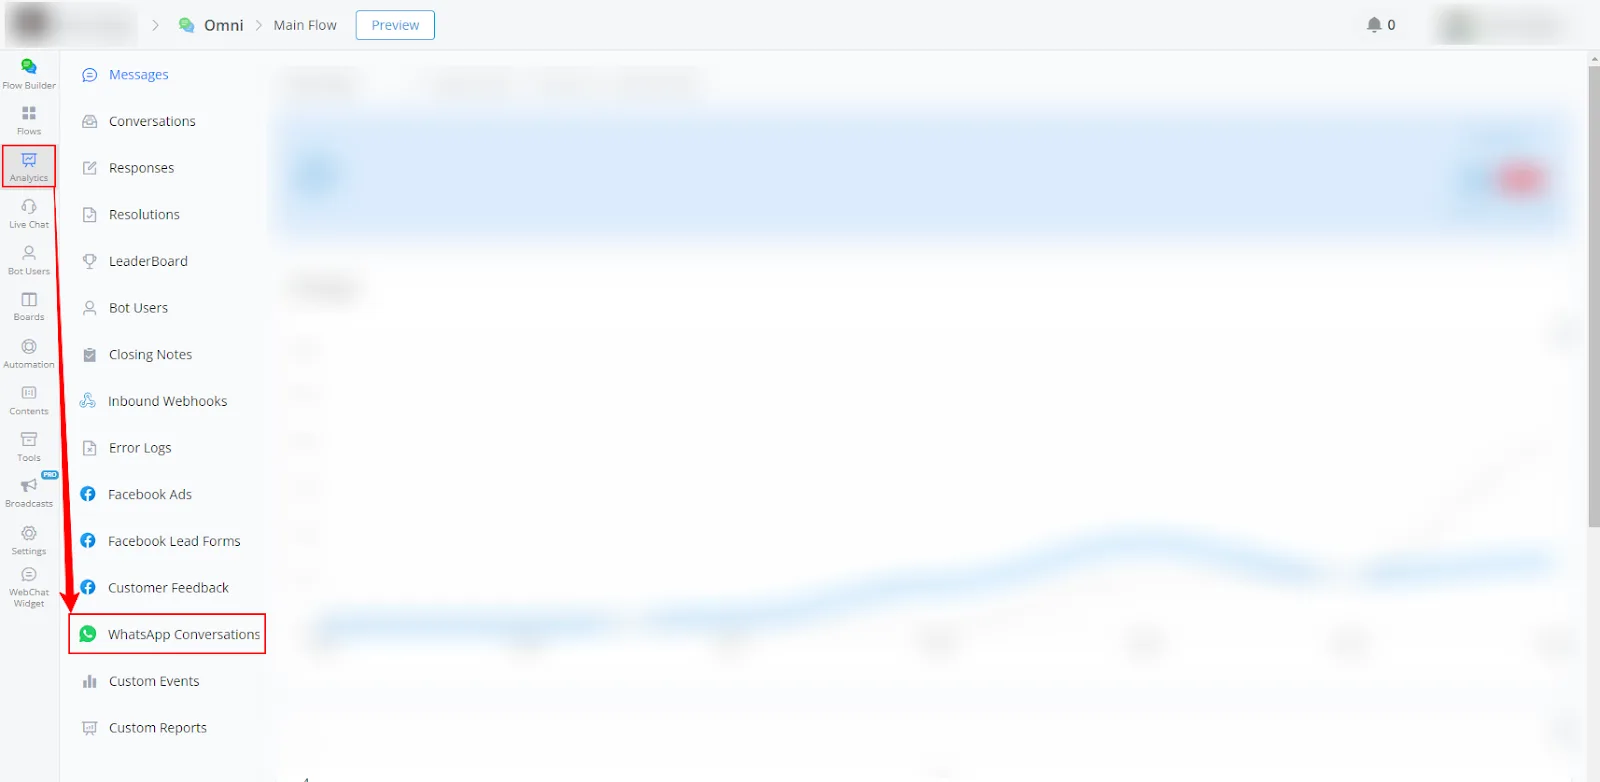
- Select WhatsApp Conversations from the left-side menu.
Available report types
Below is a brief explanation of the charts in the WhatsApp conversations reports:
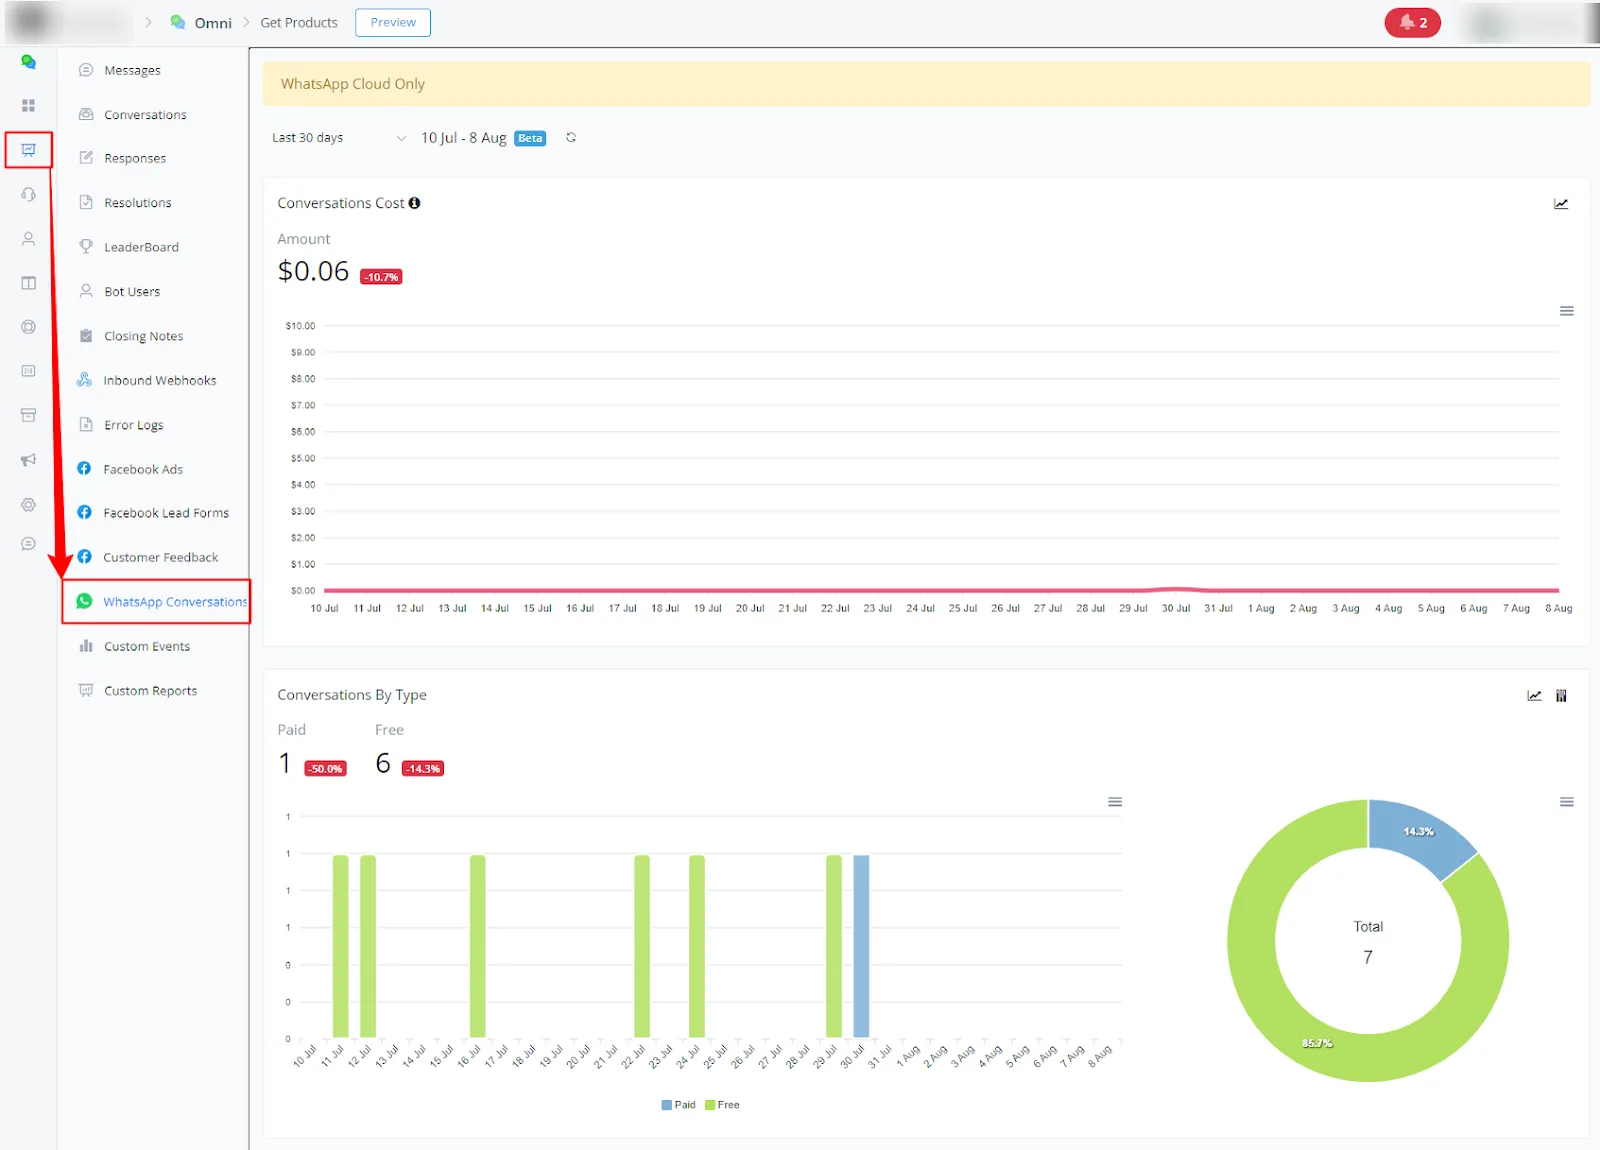
Conversations Cost:
Line chart:
- The red line represents the cumulative cost of conversations over the selected period.
Conversations By Type:
Bar chart:
- The green bars represent paid conversations.
- The light blue bars represent free conversations.
Pie chart:
- The green section shows the percentage of paid conversations.
- The light blue section shows the percentage of free conversations.
Conversations by Category:
Bar chart:
- The green bars represent marketing conversations.
- The red bars represent authentication conversations.
- The blue bars represent service conversations.
- The gray bars represent utility conversations.
Pie chart:
- The green section shows the percentage of marketing conversations.
- The red section shows the percentage of authentication conversations.
- The blue section shows the percentage of service conversations.
- The gray section shows the percentage of utility conversations.
Messages By Status:
Bar chart:
- The blue bars represent sent messages.
- The red bars represent delivered messages.
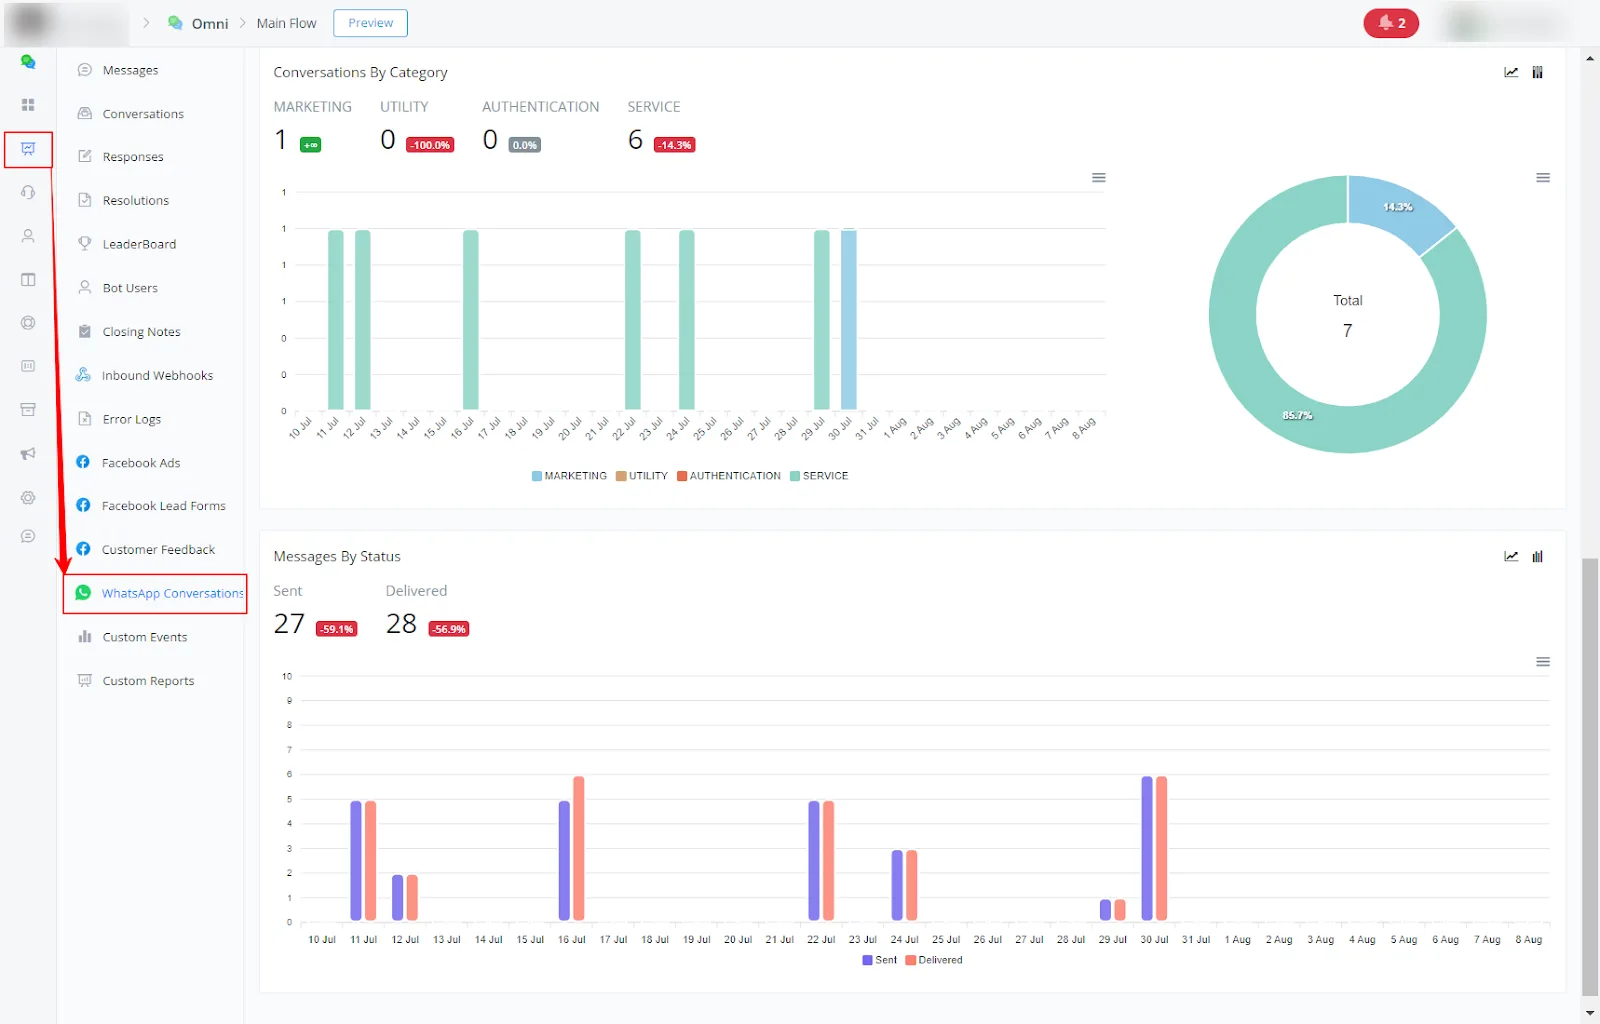
These reports help you track the costs, types, categories, and status of messages in WhatsApp conversations, and provide valuable insights for performance analysis.
If you need more help, submit a ticket at discord.com/channels/1147227963792830534/1153402986240946358