

Contacts (Statistics)
This report gathers data about the contacts that interact with the channel and offers a detailed view of their profiles and behaviors.
This report gathers data about the contacts that interact with the channel and offers a detailed view of their profiles and behaviors.
- In your channel, go to Statistics.
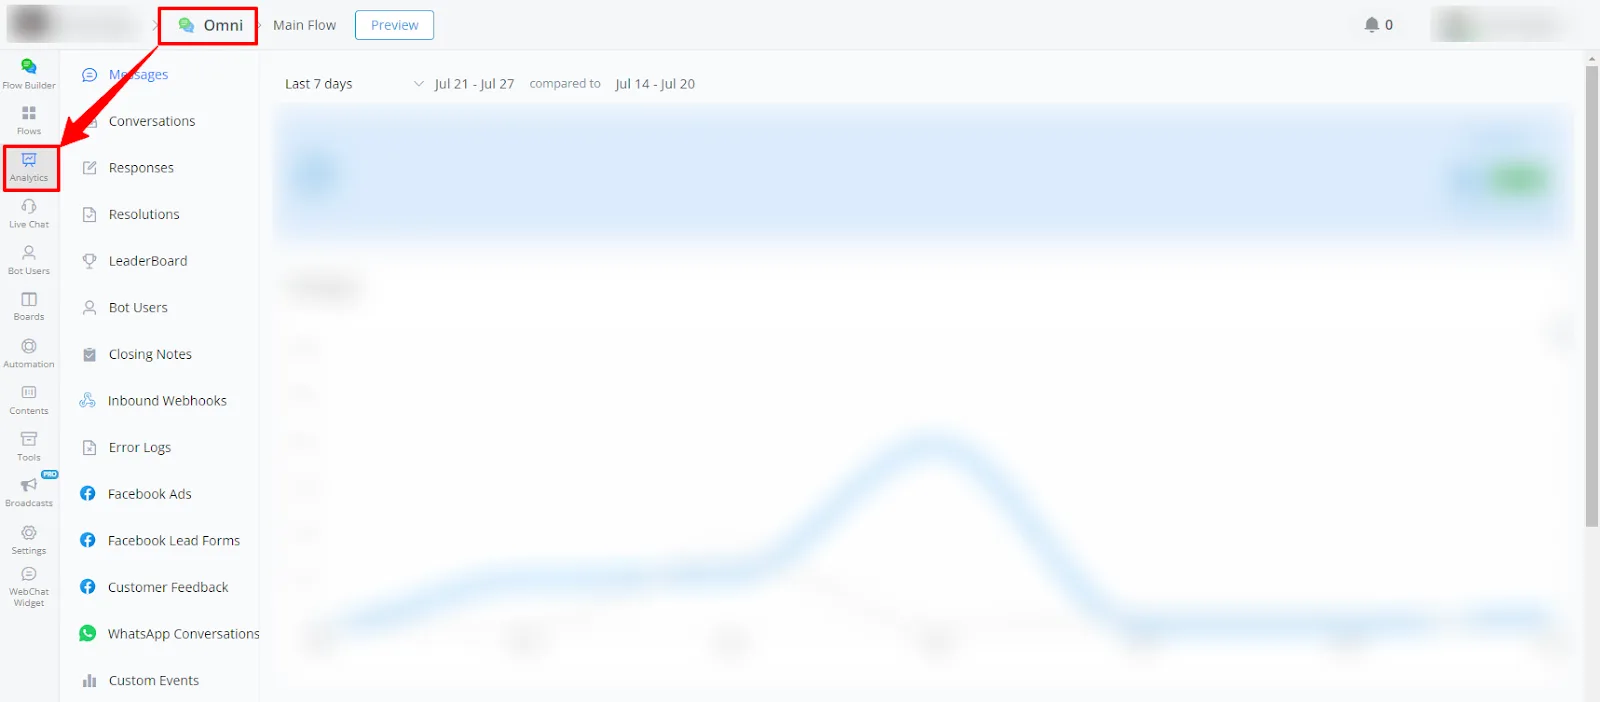
- Select Contacts from the left-side menu.
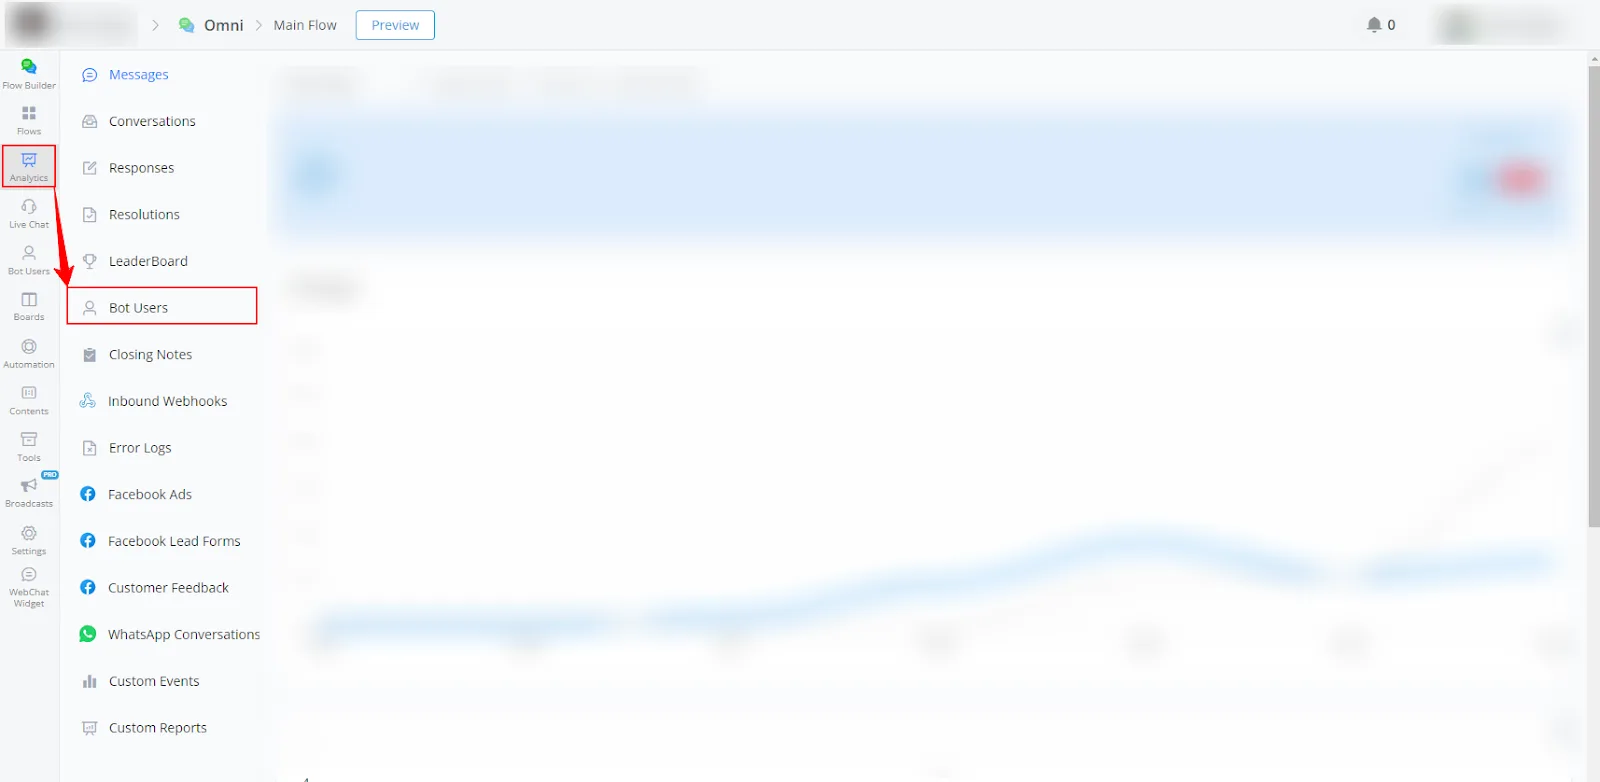
Available report types
- Contact count statistics
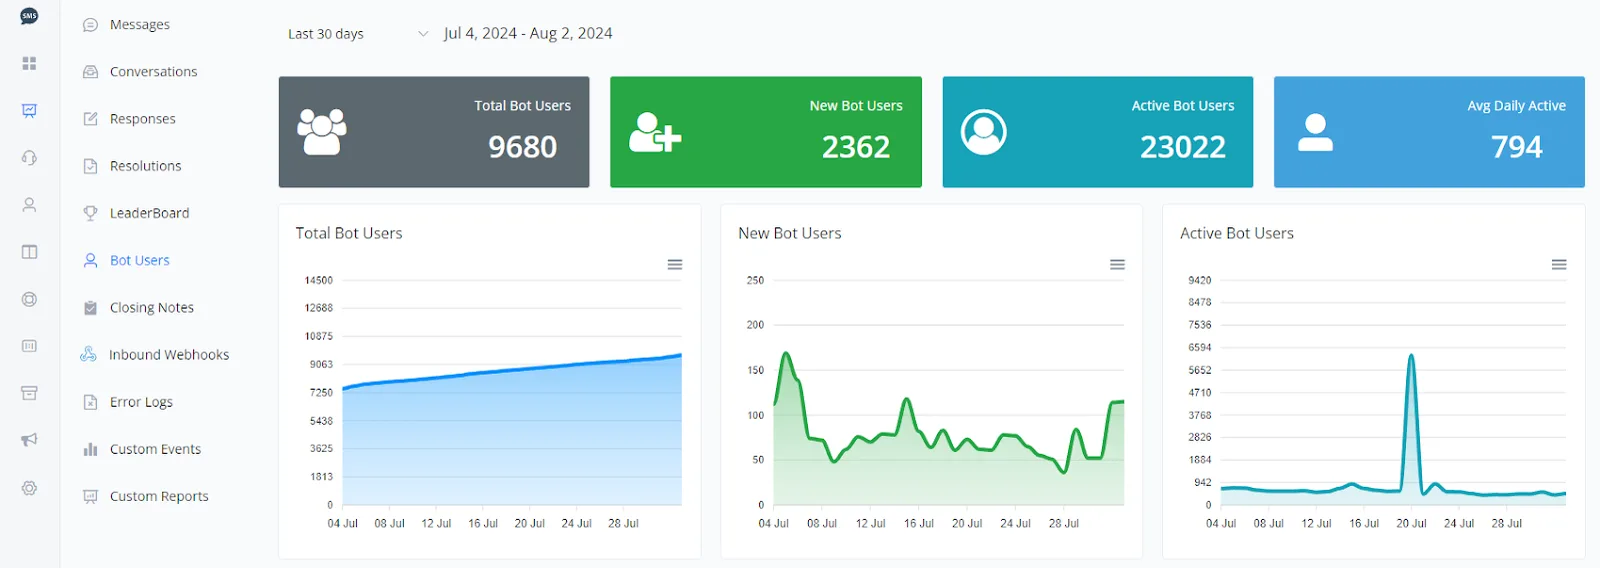
This section gives a broad view of contact statistics, with detailed charts on total contacts, new contacts, active contacts, and the daily average of active contacts.
- Line Chart: the chart shows a steady increase in the total number of contacts over the period.
- Line Chart: the chart shows the daily fluctuations in the number of new contacts, with evident peaks on specific dates.
- Line Chart: the chart shows the activity of the contacts over the period, with a significant peak on a specific date.
- Line Chart: the chart indicates the daily average of active contacts, giving a clear view of daily engagement.
- Growth evaluation: the charts help you monitor the growth in the number of contacts.
- Identification of activity peaks: it lets you identify the dates with high activity, which can be related to specific events.
- Daily engagement: the daily average of active contacts helps you assess the continuous engagement of the contacts with the channel.
See below a visual example of the charts:
- Channel usage statistics
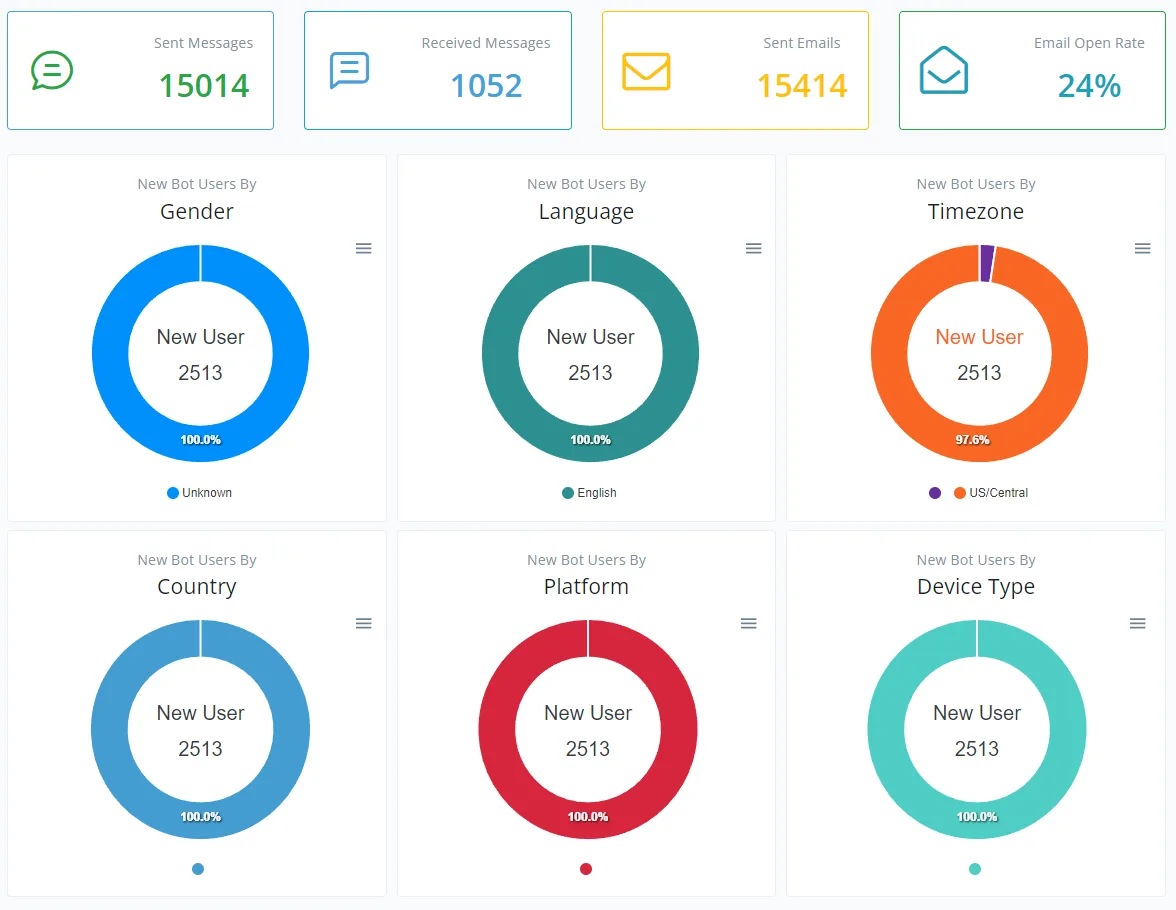
This section gives a broad view of channel usage statistics, including the number of messages sent and received, the emails sent, and the email open rate. It also brings detailed charts on new contacts by gender, language, timezone, country, platform, and device type.
- Messages Sent
- Emails Sent
- Email open rate
- Received Messages
The following charts show the distribution of new contacts across the various categories.
- Gender
- Language
- Timezone
- Country
- Platform
- Device Type
- Messages and emails analysis: it lets you monitor the volume of messages and emails generated by the channel and the email open rate, which helps you assess the effectiveness of email campaigns.
- User Profile: the charts show the profile of the new contacts, which lets you better segment and personalize interactions.
See below a visual example of the charts:
If you need more help, open a ticket at discord.com/channels/1147227963792830534/1153402986240946358