
LeaderBoard (Statistics)
The agent performance dashboard in Conversation mode offers a comprehensive view of your support team's efficiency and effectiveness. Below, we detail the main elements presented.
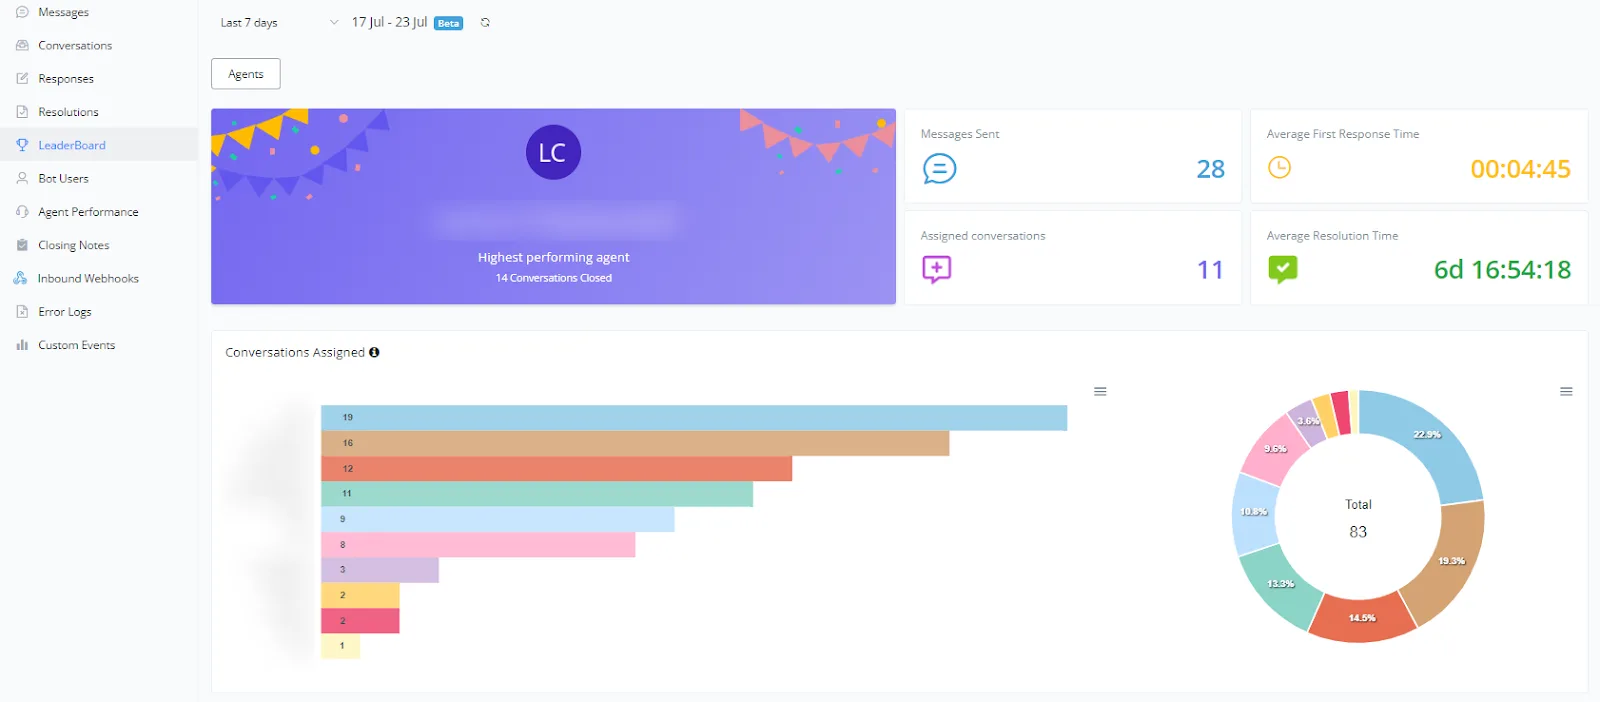
The agent performance dashboard in Conversation mode offers a comprehensive view of your support team's efficiency and effectiveness. Below, we detail the main elements presented:
- Displays the agent with the best performance in the selected period, indicating the number of closed conversations.
- Shows the total number of messages sent by the agent or by the team during the period.
- Indicates the number of conversations assigned to agents.
- Presents the average time agents take to respond to a new conversation.
- Displays the average time needed to resolve conversations.
- A bar chart shows the number of conversations assigned to each agent.
- A donut chart illustrates the percentage distribution of conversations among agents.
Below is a visual example of this dashboard:
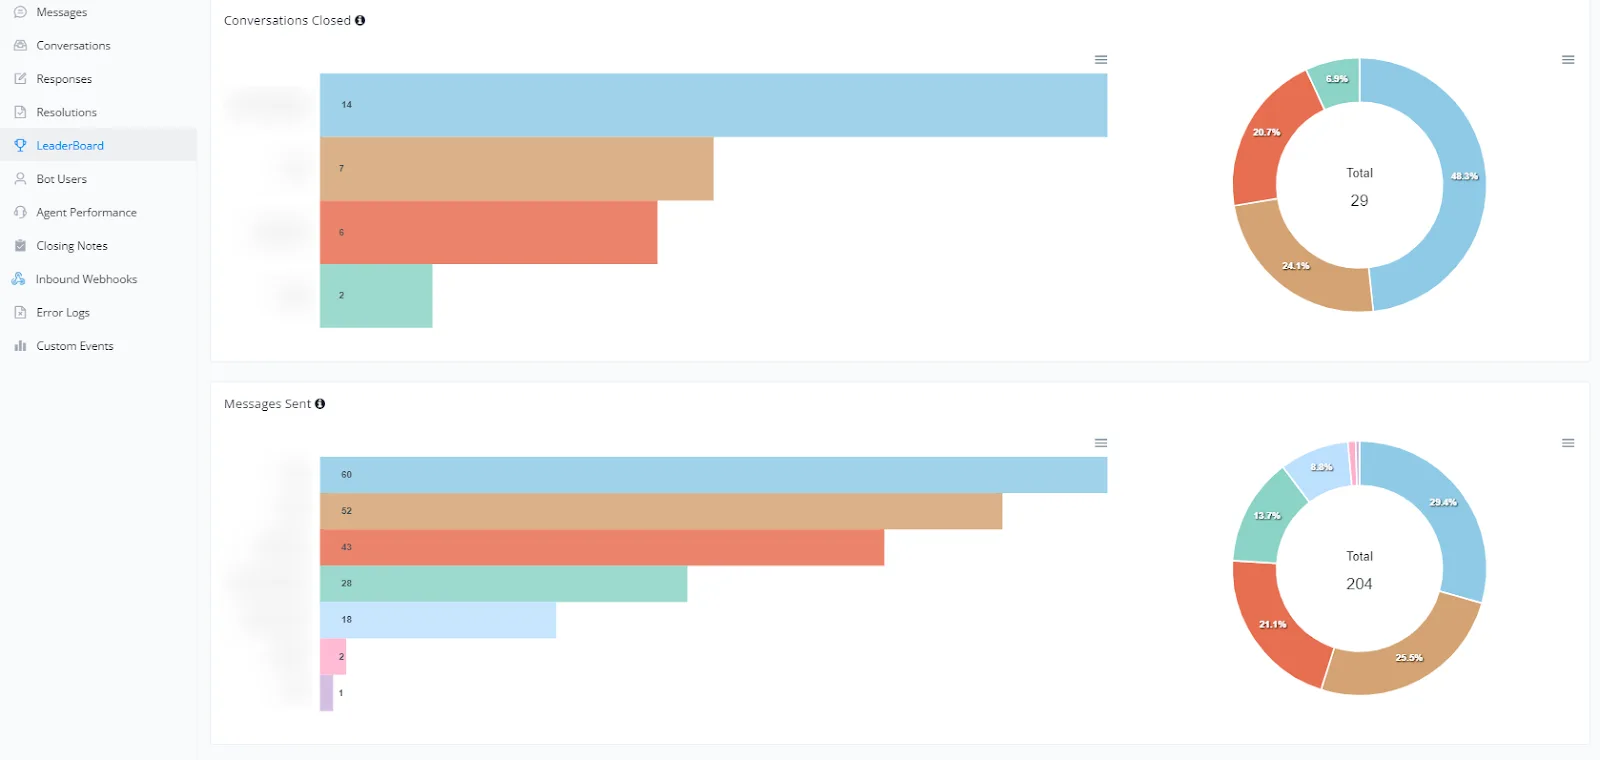
Conversation mode also lets you analyze agent performance in terms of closed conversations and messages sent. Below, we detail the information presented:
- A bar chart shows the number of conversations closed by each agent.
- A donut chart displays the percentage distribution of closed conversations among agents, giving a clear view of who is closing the most conversations.
- A bar chart details the number of messages sent by each agent.
- A donut chart illustrates the percentage distribution of messages sent, showing each agent's messaging activity.
These charts help identify performance patterns and the productivity of each agent, enabling better management and resource allocation.
Below is a visual example of these charts:
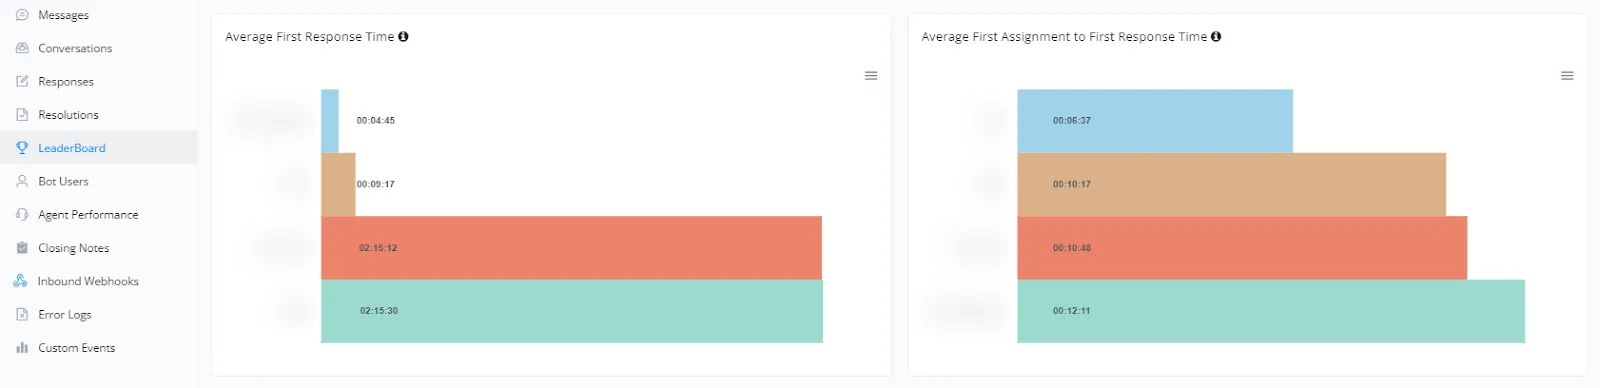
Conversation mode also provides valuable information about agent response times, focusing on the average first response time and the average time between assignment and first response. Below, we detail this information:
- A bar chart shows the average time each agent takes to give the first response to a new conversation. This helps monitor how quickly agents address customers for the first time.
- A bar chart presents the average time between the assignment of a conversation to an agent and that agent's first response. This makes it possible to analyze the agent's efficiency after receiving the conversation.
These charts are essential for evaluating how effectively agents respond quickly to customer questions, contributing to better service.
Below is a visual example of these charts:
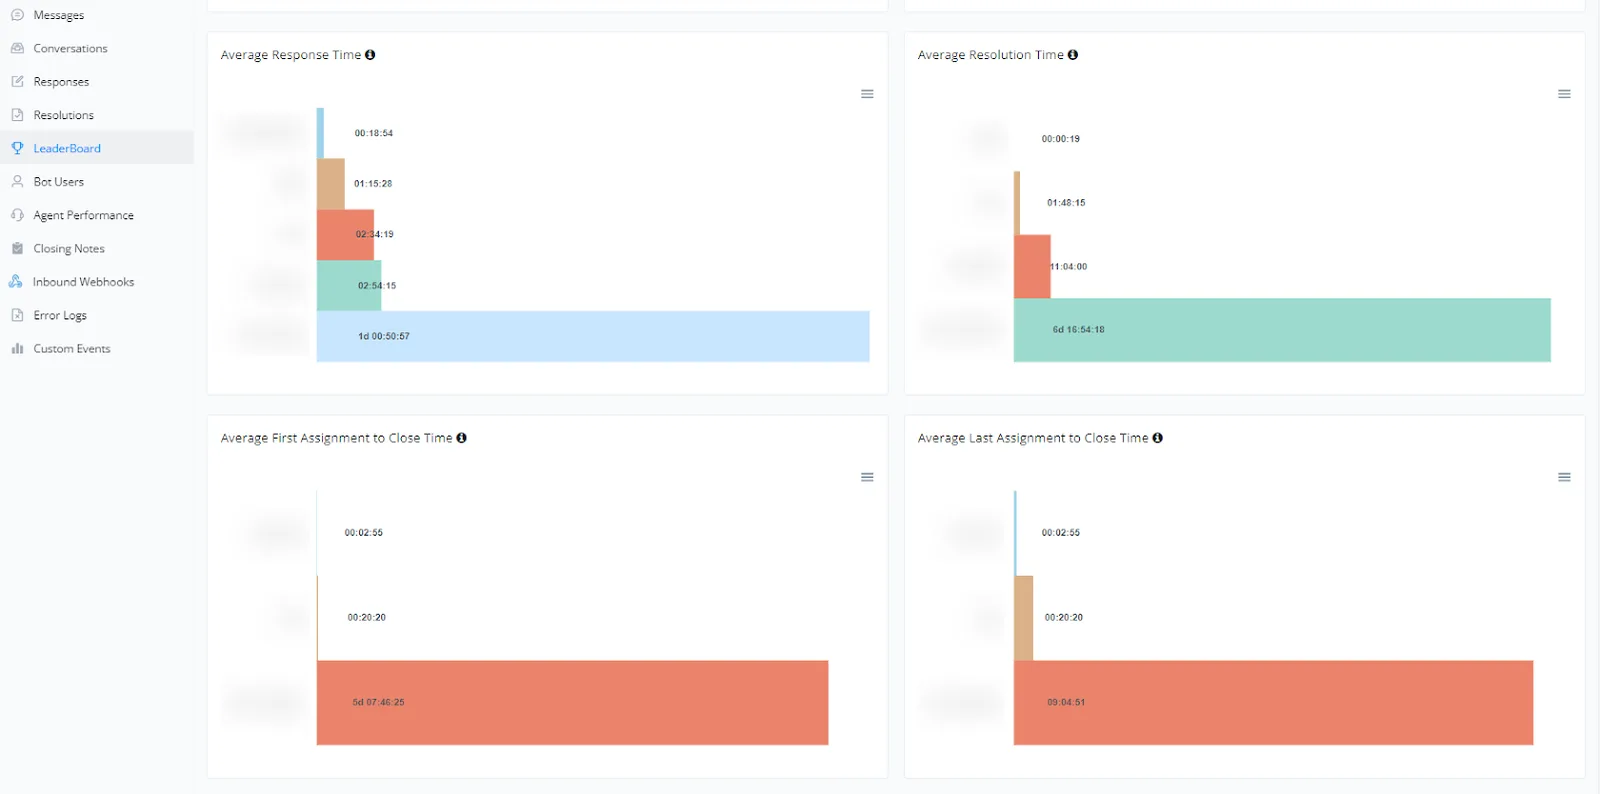
In Conversation mode, important response, resolution and closing time metrics are also monitored. These metrics help ensure efficient service and identify areas that need improvement. Below, we detail this information:
- A bar chart shows the average time each agent takes to reply to customer messages. This metric is crucial to ensure that customers receive timely responses, which improves their satisfaction.
- A bar chart presents the average time until a conversation is fully resolved. This helps monitor problem-solving efficiency and identify possible bottlenecks in the support process.
- A bar chart shows the average time between the first assignment of the conversation to an agent and its closing. This metric is useful for evaluating the overall efficiency of the support process.
- A bar chart details the average time between the last assignment of the conversation and its closing. This helps identify whether there are delays in the conversation closing process.
Below is a visual example of these charts: