

Facebook Ads (Statistics)
This report tracks the performance of the ads linked to the Facebook Channel and provides the essential data to optimize advertising campaigns.
- In your channel, go to Statistics.
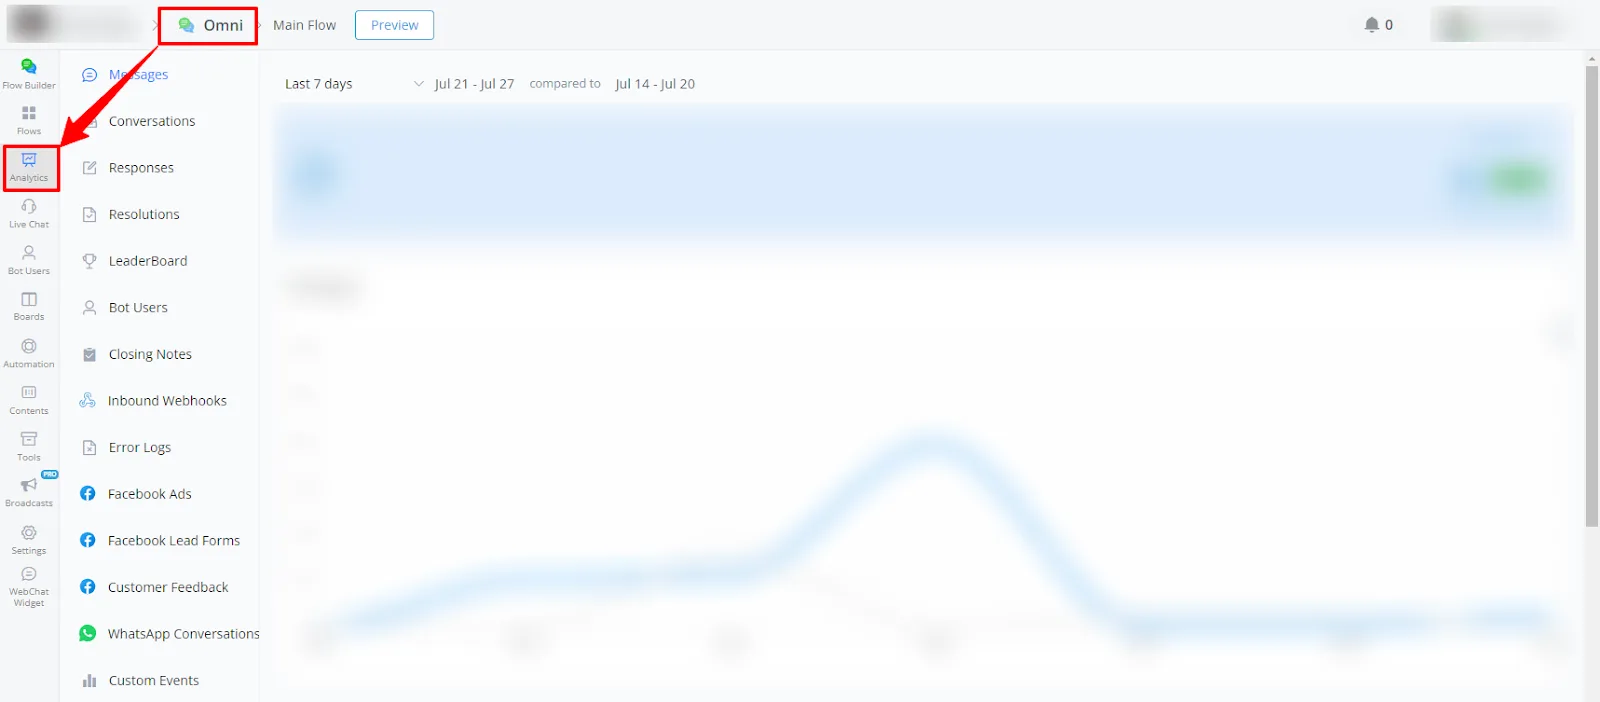
- Select Facebook Ads in the left-side menu.
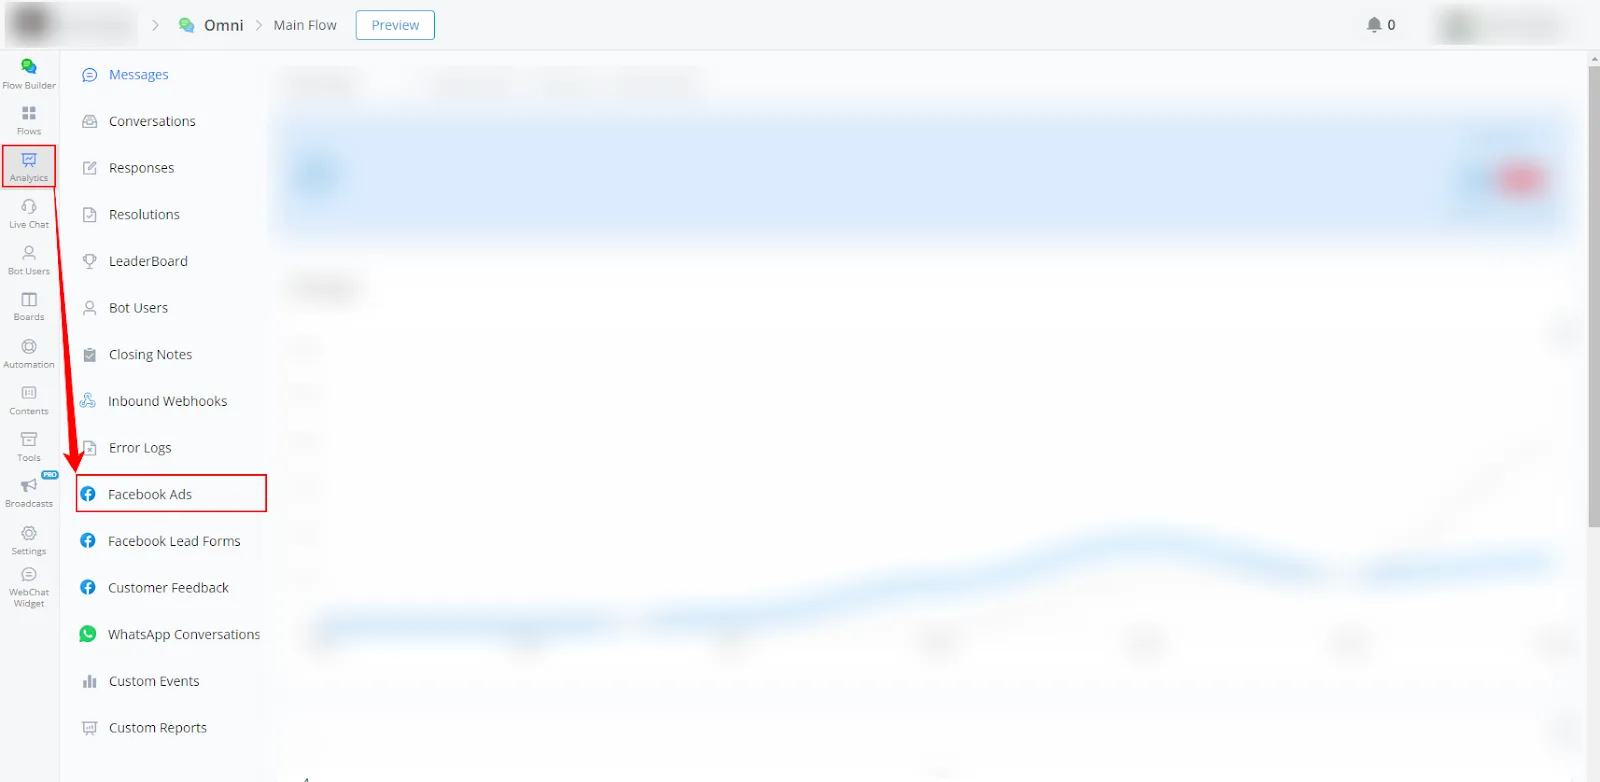
Available report types
Here is a brief explanation of the graphs in the Facebook Ads reports:
Line graphs
- Clicks:
The orange line represents the clicks in the current period. The gray line represents the clicks in the previous period. - Contacts:
The blue line represents the contacts in the current period. The gray line represents the contacts in the previous period.
Filtering
- In the Facebook Ads reports, you can filter the data displayed in the graph by all ads or by a reference payload of a specific ad, which allows for a more detailed performance analysis.
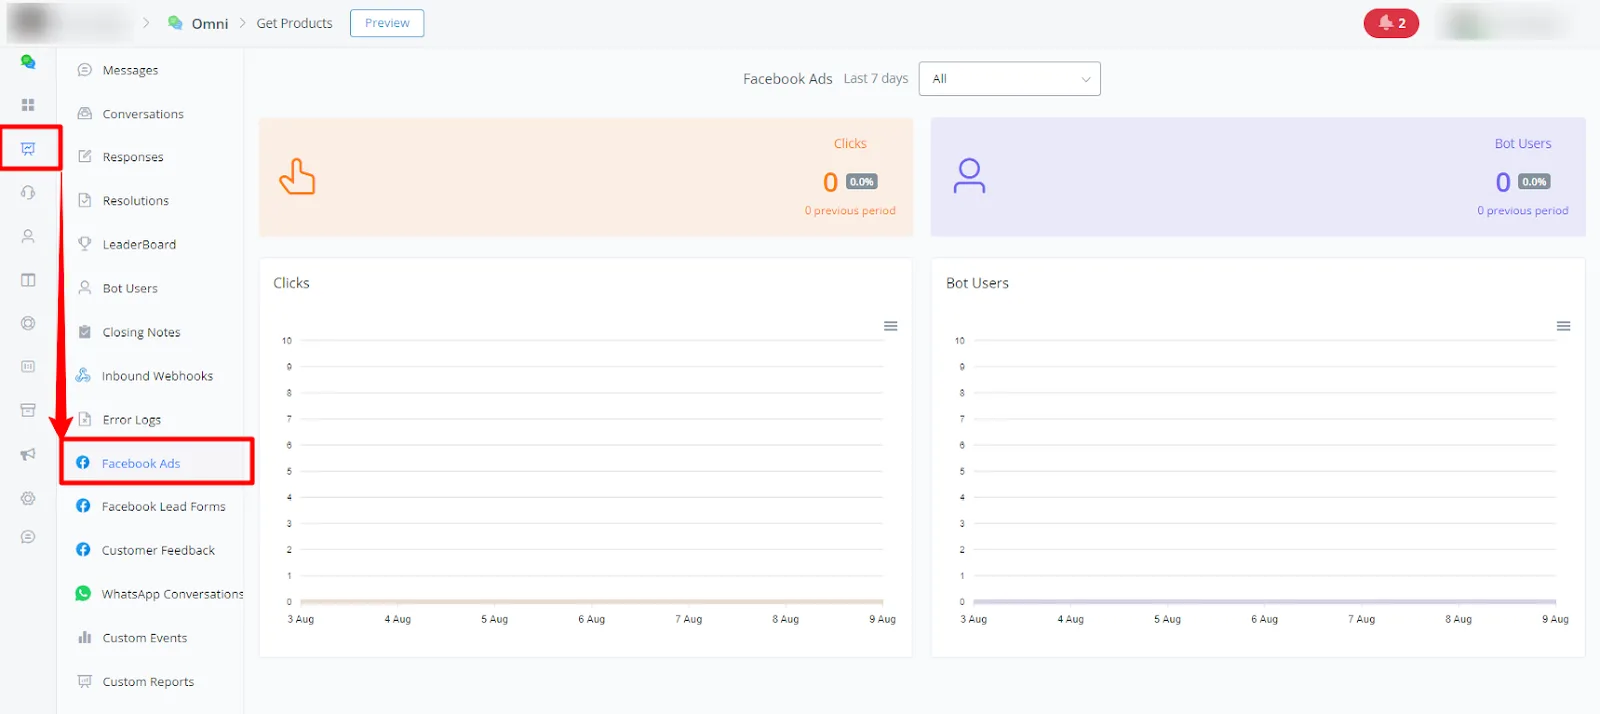
These descriptions make it clear how to interpret the graphs and how to use the available filters to analyze the relevant data in each report.
If you need further assistance, submit a ticket at discord.com/channels/1147227963792830534/1153402986240946358